• Skip to main content
  • Skip to footer
Revelwood Logo

Revelwood

Your SUPER-powered WP Engine Site

  • Who We Are
    • About Us
      • Our Company
      • Our Team
      • Partners
    • Careers
      • Join Our Team
  • What We Do
    • Solutions
      • Workday Adaptive Planning
      • IBM Planning Analytics
      • BlackLine
    • Services
      • Implementation Services
      • Customer Care
        • Help Desk
        • System Administration as a Service
      • Training
        • Workday Adaptive Planning Training
        • IBM Planning Analytics / TM1 Training
    • Products
      • DataMaestro
      • LightSpeed
      • IBM Planning Analytics Utilities
  • How We Help
    • Use Cases
    • Client Success Stories
  • How We Think
    • Knowledge Center
    • Events
    • News
  • Contact Us

Planning Analytics Tips & Tricks

IBM Planning Analytics Tips & Tricks: PAW Chart Multicolors

June 14, 2022 by Revelwood Leave a Comment

One of the visualizations in Planning Analytics is a column chart. This type of chart is a good way to compare items since all the lines are in proportion to each other.

An easy way to create a column chart is to simply create an exploration and change the visualization into a column chart. Here is an example of a stacked exploration that compares companies by scenarios and the related column chart:

Chart, histogram

Description automatically generated

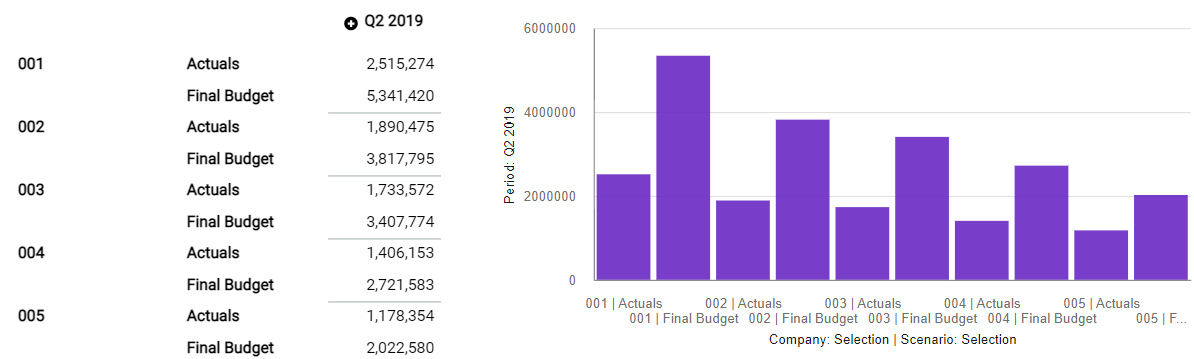
This chart is great since it’s easy to compare the high and low values. However, it’s very hard to differentiate the sub-categories since all columns are the same color. In this case, it’s hard to compare Actuals vs. Final Budget.

You can configure your chart to use multiple colors via the following steps:

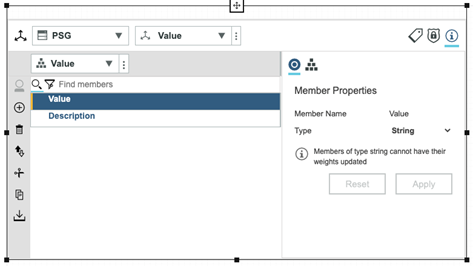
  1. While in Edit mode, single click on your chart widget.
  1. Select the option for “Fields” at the top, right corner. Not all visualizations use fields, so this may appear blank if you have not yet converted your widget to a chart.
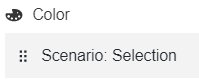
  1. Move the applicable dimension from the Length category into the Color category. In my example, color is associated with the scenario dimension.
Graphical user interface, text, application, chat or text message

Description automatically generated

Once moved, the same chart will look like this:

Chart, bar chart

Description automatically generated

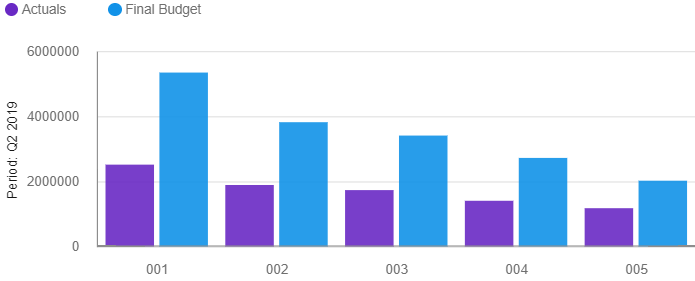
This approach will allow you to use your color palettes (defined within the properties) to differentiate the dimensions within your stacked column chart and make your analyses easier.

Revelwood has worked with IBM Planning Analytics / TM1 for more than 27 years. We’ve partnered with hundreds of companies on the design, development, maintenance and updates of IBM Planning Analytics applications, across every industry. Have a challenge with Planning Analytics / TM1? We can help you!

Read more IBM Planning Analytics Tips & Tricks:

IBM Planning Analytics Tips & Tricks: PAW Visualization Value Labels

IBM Planning Analytics Tips & Tricks: Refresh PAW Visualizations Automatically

IBM Planning Analytics Tips & Tricks: PAW Maps

Home » Planning Analytics Tips & Tricks » Page 2

Filed Under: IBM Planning Analytics Tips & Tricks Tagged With: enterprise performance management, Excel functions, Financial Performance Management, IBM Cognos TM1, IBM Planning Analytics, Planning & Forecasting, Planning Analytics Tips & Tricks, TM1

IBM Planning Analytics Tips & Tricks: NumberToStringEx

June 7, 2022 by Revelwood Leave a Comment

IBM Planning Analytics has the ability to export data to flat files with the use of the ASCIIOUTPUT and TEXTOUTPUT functions. However, these two functions will only accept string variables. That means that numeric data will first need to be converted to string before exporting. Most developers know about the NumberToString function, which converts numbers to string, but there’s another function that is more powerful.

NumberToString does not apply any formatting to the numbers. This will work fine if the export is meant to be consumed by another system. However, if your export has an audience, you may want your report to have consistent and pleasing formatting. Here’s where the NumberToStringEx function can come in handy.

The NumberToStringEx function has four parameters: Value, Number Format, Decimal Separator, and Thousands Separator. The number format uses the same structures as the custom formatting in Excel.  Here’s an example of the function with the results:

NumberToStringEx( 1750.34892, ‘$#,0.00’, ‘.’, ‘,’)
$1,750.35

As you can see, the NumberToStringEx function eliminates the need to round your numbers prior to conversion as well as concatenating special characters after conversion.  

NumberToStringEx also allows for dual formatting of positive and negative numbers. Just like in Excel, you will need to separate the two using a semicolon. This eliminates any IF conditions you’ll need to use to format numbers if you had used the NumberToString function.

NumberToStringEx( -1750.34892, ‘$#,0.00;($#,0.00)‘, ‘.’, ‘,’)
($1,750.35) 

Revelwood has worked with IBM Planning Analytics / TM1 for more than 27 years. We’ve partnered with hundreds of companies on the design, development, maintenance and updates of IBM Planning Analytics applications, across every industry. Have a challenge with Planning Analytics / TM1? We can help you!

Read more IBM Planning Analytics Tips & Tricks:

IBM Planning Analytics Tips & Tricks: Planning Analytics Workspace Process Editor Function Help

IBM Planning Analytics Tips & Tricks: Excel OFFSET Function

IBM Planning Analytics Tips & Tricks: The SCAN Function

Home » Planning Analytics Tips & Tricks » Page 2

Filed Under: IBM Planning Analytics Tips & Tricks Tagged With: enterprise performance management, Excel functions, IBM Cognos TM1, IBM Planning Analytics, Planning Analytics Tips & Tricks, TM1

IBM Planning Analytics Tips & Tricks: Feeding Using Cube Values

May 11, 2021 by Nina Inverso Leave a Comment

Feeders are one of the best ways to maximize the performance of rules. Essentially, feeders define where to perform calculations to better handle sparsity in a cube.

There are many ways to reference feeder elements. One of these ways is by using DB statements within the feeder. When creating feeders that use DB statements, be sure that all pointers to the elements within the DB statement reference a string value.

The following example states that the Forecast Year, defined in the Controls cube, is fed by Actuals.

[‘Actuals’] =>
DB(‘Finance’,
!Scenario,
!Company,
!Department,
!Account,
DB(‘Controls’, ‘Forecast Year’, ‘Value’),
!Measure);

If the inner DB statement (the one referencing the Controls cube) pulls a number instead of a string, then the Feeder will not work. We can avoid this issue by ensuring that the element called “Value” has been set to a String.

IBM Planning Analytics Tips & Tricks: Feeding Using Cube Values

IBM Planning Analytics, powered by TM1, is full of new features and functionality. Need advice? Our team here at Revelwood can help. Contact us for more information at info@revelwood.com. We post new Planning Analytics Tips & Tricks weekly in our Knowledge Center and in newsletters.

Read more IBM Planning Analytics Tips & Tricks:

IBM Planning Analytics Tips & Tricks: The CellValueN Formula

IBM Planning Analytics Tips & Tricks: Clearing All Data from a Cube

IBM Planning Analytics Tips & Tricks: Filter in IBM Planning Analytics Workspace

Home » Planning Analytics Tips & Tricks » Page 2

Filed Under: IBM Planning Analytics Tips & Tricks Tagged With: Cognos TM1, IBM Planning Analytics, Planning Analytics Tips & Tricks

IBM Planning Analytics Tips & Tricks: PAW Gridlines

April 20, 2021 by Lee Lazarow Leave a Comment

Have you ever created a PowerPoint slide by using gridlines to position your pieces and wished that you can do the same in IBM Planning Analytics (PAW)? Now you can! 

PAW version 57 introduced many settings that allow you to further customize and position your widgets. One specific setting is found within the general area of the dashboard properties settings.

The Grid section contains a setting which allows you to enable or disable a grid on the page.

IBM Planning Analytics Tips & Tricks: PAW Gridlines

Here are examples of a dashboard with the grid turned on and with the grid turned off:

IBM Planning Analytics Tips & Tricks: PAW Gridlines

In addition, there are options which allow you enable or disable various “snap to” settings.

These new settings give you a more visual approach when creating your PAW books and help make your development easier.

IBM Planning Analytics, powered by TM1, is full of new features and functionality. Need advice? Our team here at Revelwood can help. Contact us for more information at info@revelwood.com. We post new Planning Analytics Tips & Tricks weekly in our Knowledge Center and in newsletters!

Read more IBM Planning Analytics Tips & Tricks

IBM Planning Analytics Tips & Tricks: Log Lock Notification

IBM Planning Analytics Tips & Tricks: Create New Books with the Diamond Icon

IBM Planning Analytics Tips & Tricks: The Waterfall Chart

Home » Planning Analytics Tips & Tricks » Page 2

Filed Under: IBM Planning Analytics Tips & Tricks Tagged With: enterprise performance management, Financial Performance Management, IBM Cognos TM1, IBM Planning Analytics, IBM Planning Analytics Workspace, Planning Analytics tips, Planning Analytics Tips & Tricks

IBM Planning Analytics Tips & Tricks: MS Word AutoCorrect

March 30, 2021 by Lee Lazarow Leave a Comment

Tips & Tricks

Part of implementing IBM Planning Analytics is ensuring that users understand their model. This often entails documentation that is created as a Microsoft Word document. Most of us know how to use Word but get frustrated typing some of the complex OLAP terms that are required to explain the model. Did you know that Word has a feature which allows you to solve this?

The AutoCorrect feature in Word allows you to define an abbreviation which is replace when you complete a word. This is defined by going into the Word options and selecting Proofing, AutoCorrect Options.

IBM Planning Analytics Tips & Tricks: MS Word Auto Correct

In addition to the list of predefined abbreviations that Microsoft has set up, I use this for the following list of words:

Abbreviation   Full Phrase

consol              consolidation

consols            consolidations

dim                  dimension

dims                dimensions

hier                  hierarchy

hiers                hierarchies

scen                 scenario

I also use this to quickly set up arrows and bullets:

—                      → (an arrow)

*                      •   (a bullet point)

This approach will help you create documents, both notes and formal manuals, faster and easier vs. having to stop and correct the complicated words that arise in our OLAP world.

IBM Planning Analytics, which TM1 is the engine for, is full of new features and functionality. Not sure where to start? Our team here at Revelwood can help. Contact us for more information at info@revelwood.com. And stay tuned for more Planning Analytics Tips & Tricks weekly in our Knowledge Center and in upcoming newsletters!

Learn more IBM Planning Analytics Tips & Tricks:

IBM Planning Analytics Tips & Tricks: Learn the Excel CELL Formula

IBM Planning Analytics Tips & Tricks: Manipulating Text in Excel

IBM Planning Analytics Tips & Tricks: Excel Keyboard Navigation

Home » Planning Analytics Tips & Tricks » Page 2

Filed Under: IBM Planning Analytics Tips & Tricks, Uncategorized Tagged With: enterprise performance management, Financial Performance Management, FP&A, IBM Cognos TM1, IBM Planning Analytics, MS word autocorrect, Planning Analytics tips, Planning Analytics Tips & Tricks, TM1

IBM Planning Analytics Tips & Tricks: Administration Page Layout

March 23, 2021 by Dillon Rossman Leave a Comment

Tips & Tricks

Did you know that the administration page layout has changed in IBM Planning Analytics Workspace (PAW) update 57?

In previous versions of PAW, the administration page used a tabbed approach that separated each component into its own tab. This required administrators to click through each tab to gain insight on a single component.

IBM Planning Analytics Tips & Tricks: Administration Page Layout

In PAW version 57 and later the administration page uses a tiled approach. Each tile represents the individual components of PAW administration. IBM has also incorporated some basic insights for several components. This provides a singular place where administrators can see a high-level status of PAW rather than having to click through each tab. If an administrator spots an issue or needs further information for a specific component then he/she can simply click into the tile.

IBM Planning Analytics Tips & Tricks: Administration Page Layout

IBM Planning Analytics, which TM1 is the engine for, is full of new features and functionality. Not sure where to start? Our team here at Revelwood can help. Contact us for more information at info@revelwood.com. And stay tuned for more Planning Analytics Tips & Tricks weekly in our Knowledge Center and in upcoming newsletters!

Read more IBM Planning Analytics Tips & Tricks:

IBM Planning Analytics Tips & Tricks: Home Button

IBM Planning Analytics Tips & Tricks: Merge an Icon and a Button, Part 1

IBM Planning Analytics Tips & Tricks: Merge an Icon and a Button, Part 2

Home » Planning Analytics Tips & Tricks » Page 2

Filed Under: IBM Planning Analytics Tips & Tricks Tagged With: enterprise performance management, Financial Performance Management, IBM Cognos TM1, IBM Planning Analytics, IBM Planning Analytics administration, IBM Planning Analytics Workspace, Planning Analytics tips, Planning Analytics Tips & Tricks, Planning Analytics Workspace, TM1, TM1 administration

IBM Planning Analytics Tips & Tricks: Planning Analytics Forecasting – Setting up the Forecast

March 9, 2021 by Nina Inverso Leave a Comment

This is part three in a three-part series on IBM Planning Analytics’ new feature, Forecasting. 

In our previous blog about IBM Planning Analytics’ new Forecasting feature, we reviewed the steps required to preview your forecast. Once previewed, you can then run your Forecast.

  1. Open a Planning Analytics Workspace (PAW) book and add a new cube view. Setting up the forecast in IBM Planning Analytics Forecasting
  2. Place the time dimension’s flat hierarchy alone on the columns. As of PAW version 2.0.60, you will no longer be required to display the entire hierarchy on the view. Instead, you will have the option to select the scope of the historical data used in the forecast.
  3. Select the context and row elements to forecast. For example:
    • Drag the account dimension on top of the source dimension to swap their positions.
    • Click on the version dimension to select a different version of the data from the drop-down list.
    • Double-click on the account dimension to select the row elements. Setting up the forecast in IBM Planning Analytics Forecasting

Your PAW cube view is now ready as a Planning Analytics Forecasting model.

IBM Planning Analytics, which TM1 is the engine for, is full of new features and functionality. Not sure where to start? Our team here at Revelwood can help. Contact us for more information at info@revelwood.com. And stay tuned for more Planning Analytics Tips & Tricks weekly in our Knowledge Center and in upcoming newsletters!

Read more IBM Planning Analytics Tips & Tricks:

IBM Planning Analytics Tips & Tricks: Planning Analytics Forecasting – Configuring the Time Dimension

IBM Planning Analytics Tips & Tricks: Planning Analytics Forecasting – Configuring the Forecast Settings

IBM Planning Analytics Tips & Tricks: Planning Analytics Forecasting – Previewing the Forecast

Home » Planning Analytics Tips & Tricks » Page 2

Filed Under: IBM Planning Analytics Tips & Tricks Tagged With: Budgeting Planning & Forecasting, enterprise performance management, Financial Performance Management, IBM Cognos TM1, IBM Planning Analytics, IBM Planning Analytics Forecasting, Planning & Forecasting, Planning Analytics tips, Planning Analytics Tips & Tricks, Revelwood, setting up forecast + Planning Analytics, TM1

IBM Planning Analytics Tips & Tricks: Planning Analytics Forecasting – Previewing the Forecast

March 2, 2021 by Nina Inverso Leave a Comment

This is part two of a three-part series on IBM Planning Analytics new Forecasting feature. 

In our first blog about Planning Analytics’ new Forecasting feature, we reviewed the steps required to configure your forecast. Once configured, you can then preview your forecast before to get a better idea of the results prior to populating the cube.

  1. Open the PAW book that contains your forecast view. Previewing the forecast in IBM Planning Analytics
  2. Click anywhere on the view to activate it. Then click the Forecast icon in the ribbon at the top of the screen. This will open the Forecast window on the right-hand side of your screen. Configure the forecast settings if you have not already done so. Previewing the forecast in IBM Planning Analytics
  3. Click on one of the elements in your row dimension to select the row. Then click the Preview button in the Forecast window on the right-hand side of your screen. Previewing the forecast in IBM Planning Analytics
  4. The Forecast preview window will open. There are two tabs with information about the forecast:

a. Preview chart

Previewing the forecast in IBM Planning Analytics

The Preview chart depicts displays the forecasted data, along with a surrounding shaded area. There is a 95% chance that the actual values will fall in this shaded area (or cloud).

b. Statistical details

Previewing the forecast in IBM Planning Analytics

The Statistical details tab provides key information used by the model to forecast your data. Read more about these values here.

In our next blog post, we will review how to run your Planning Analytics Forecasting model.

IBM Planning Analytics, which TM1 is the engine for, is full of new features and functionality. Not sure where to start? Our team here at Revelwood can help. Contact us for more information at info@revelwood.com. And stay tuned for more Planning Analytics Tips & Tricks weekly in our Knowledge Center and in upcoming newsletters!

Read more IBM Planning Analytics Tips & Tricks:

IBM Planning Analytics Tips & Tricks: Configuring the Time Dimension

IBM Planning Analytics Tips & Tricks: Configuring the Forecast Settings

IBM Planning Analytics Tips & Tricks: Convert Existing View Directly to Reports

Home » Planning Analytics Tips & Tricks » Page 2

Filed Under: IBM Planning Analytics Tips & Tricks Tagged With: Budgeting Planning & Forecasting, enterprise performance management, Financial Performance Management, IBM Cognos TM1, IBM Planning Analytics, IBM Planning Analytics Forecasting, Planning & Forecasting, Planning Analytics tips, Planning Analytics Tips & Tricks, TM1

IBM Planning Analytics Tips & Tricks: Planning Analytics Forecasting – Configuring the Time Dimension

February 16, 2021 by Nina Inverso Leave a Comment

Tips & Tricks

The new IBM Planning Analytics Forecasting feature allows you to quickly populate future time periods based on past data values. This feature is especially useful to prepopulate a data set for you or your team to then adjust as you see fit. Because it is time-based, the feature requires that a time dimension has been set up in a specific way.

  1. Ensure that the cube where you want to forecast includes a time dimension.
  2. Make sure the dimension type is set to TIME.

    a. Sign into PAW and open a new book. In the navigation pane, right-click on the Dimensions section, and click Edit settings. 

    Configuring Time Dimension in IBM Planning Analytics Forecasting Model

    b. Click on the Dimensions Attributes Mode button in the upper right-hand corner of the window.

    Learn how to configure the time dimension in IBM Planning Analytics Forecasting Model

    c. Enter TIME as the DIMENSION_TYPE if blank.

    How to configure the time dimension in IBM Planning Analytics Forecasting Model
  3. Make sure you have a flat hierarchy available.

    a. In the navigation pane, right-click on the dimension name, and click Create hierarchy.

    Understand how to configure the time dimension in IBM Planning Analytics Forecasting Model

    b. Enter a new hierarchy name and click the CREATE button.

    Learn to configure the time dimension in IBM Planning Analytics Forecasting Model

    c. Use the dimension editor to add base-level time elements to the new hierarchy. The easiest way to accomplish this is by copying element names from an existing hierarchy in the dimension.

    Your time dimension is now ready to use in a Planning Analytics Forecasting model.

IBM Planning Analytics, which TM1 is the engine for, is full of new features and functionality. Not sure where to start? Our team here at Revelwood can help. Contact us for more information at info@revelwood.com. And stay tuned for more Planning Analytics Tips & Tricks weekly in our Knowledge Center and in upcoming newsletters!

Read more IBM Planning Analytics Tips & Tricks:

IBM Planning Analytics Tips & Tricks: Converting Existing View Directly to Reports

IBM Planning Analytics Tips & Tricks: PAx Task Pane Workbook Tab

IBM Planning Analytics Tips & Tricks: Maintaining Subset Driven Consolidations

Home » Planning Analytics Tips & Tricks » Page 2

Filed Under: IBM Planning Analytics Tips & Tricks Tagged With: Budgeting Planning & Forecasting, enterprise performance management, Financial Performance Management, forecasting, IBM Cognos TM1, IBM Planning Analytics, Planning & Forecasting, Planning Analytics Forecasting model, Planning Analytics Tips & Tricks, TM1

  • « Go to Previous Page
  • Page 1
  • Page 2
  • Page 3
  • Page 4
  • Interim pages omitted …
  • Page 7
  • Go to Next Page »

Footer

Revelwood Overview

Revelwood helps finance organizations close, consolidate, plan, monitor and analyze business performance. As experts in solutions for the Office of Finance, we partner with best-in-breed software companies by applying best practices guidance and our pre-configured applications to help businesses achieve their full potential.

EXPERTISE

  • Workday Adaptive Planning
  • IBM Planning Analytics
  • BlackLine

ABOUT

  • Who We Are
  • What We Do
  • How We Help
  • How We Think
  • Privacy

CONNECT

World Headquarters

Florham Park, NJ | 201 984 3030

European Headquarters

London & Edinburgh | +44 (0)131 240 3866

Latin America Office

Miami, FL | 201 987 4198

Email
info@revelwood.com

Copyright © 2025 · Revelwood Inc. All rights reserved. Revelwood® and the Revelwood logo are registered marks of Revelwood Inc.