• Skip to main content
  • Skip to footer
Revelwood Logo

Revelwood

Your SUPER-powered WP Engine Site

  • Who We Are
    • About Us
      • Our Company
      • Our Team
      • Partners
    • Careers
      • Join Our Team
  • What We Do
    • Solutions
      • Workday Adaptive Planning
      • IBM Planning Analytics
      • BlackLine
    • Services
      • Implementation Services
      • Customer Care
        • Help Desk
        • System Administration as a Service
      • Training
        • Workday Adaptive Planning Training
        • IBM Planning Analytics / TM1 Training
    • Products
      • DataMaestro
      • LightSpeed
      • IBM Planning Analytics Utilities
  • How We Help
    • Use Cases
    • Client Success Stories
  • How We Think
    • Knowledge Center
    • Events
    • News
  • Contact Us

Analytics

IBM Planning Analytics Tips & Tricks: The CellValueN Formula

May 19, 2020 by Lee Lazarow Leave a Comment

Tips & Tricks

Rules in IBM Planning Analytics allow you to reference components of a cube as part of your formula … either from the cube you are currently in or from another cube. This is done via the use of the DB function. The syntax of the DB function is:

DB(cube, elem1, elem2, …)

Where each elem value references an element from the dimensions of the cube, in the order of the cube definition.

This is a great formula if you know all the dimensions of your cube in the proper order. But what if you don’t want to have to define every dimension in your cube?

Planning Analytics also allows you to use a formula called CellValueN. The syntax of the CellValueN function is the same as the other formula:

CELLVALUEN (cube, elem1, elem2, …)

… but there are some differences when using this formula.

  • You do not have to reference every dimension! Any undefined dimensions are the equivalent of using the exclamation point, often called a “bang.” This means that you only need to reference dimensions/elements that are different from the source value.
  • Since you are not putting your dimensions in order, you must reference the dimension name in front of each element. The dimension name must be written within a set of single quotes, a colon is then used without quotes, and the element is then written within another set of single quotes.

For example, account 605100 would be written as ‘Account’:‘605100’

  • There are different versions of the rule. One version is CellValueN which pulls numeric values and one version is CellValueS which pulls string values.

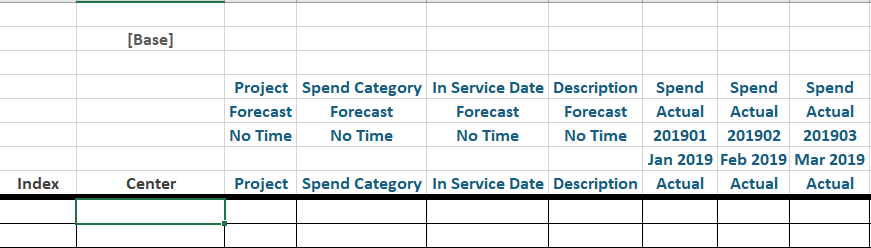
Here is an example of the rule. Note that the cube contains seven dimensions but the formula only references two of them.

IBM Planning Analytics Tips & Tricks: CellValueN Formula

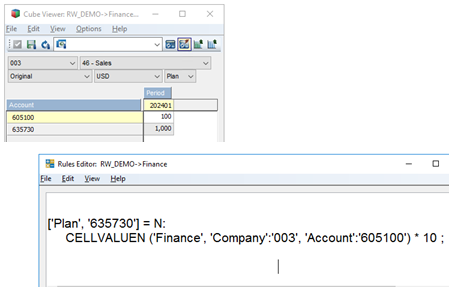
This approach allows you to simplify your rules by referencing a data point without having to reference every dimension within the cube.

IBM Planning Analytics, which TM1 is the engine for, is full of new features and functionality. Not sure where to start? Our team here at Revelwood can help. Contact us for more information at info@revelwood.com. And stay tuned for more Planning Analytics Tips & Tricks weekly in our Knowledge Center and in upcoming newsletters! You can also sign up to get our Planning Analytics Tips & Tricks sent directly to your inbox!

Read more IBM Planning Analytics Tips & Tricks:

IBM Planning Analytics Tips & Tricks: Learn the Excel CELL Formula

IBM Planning Analytics Tips & Tricks: IFERROR

IBM Planning Analytics Tips & Tricks: Excel’s CONCAT and TEXTJOIN Functions

Home » Analytics » Page 5

Filed Under: IBM Planning Analytics Tips & Tricks Tagged With: Analytics, Financial Performance Management, IBM Cognos TM1, IBM Planning Analytics, lee lazarow, Planning Analytics Tips & Tricks, Revelwood, TM1

IBM Planning Analytics Tips & Tricks: Max Number of ELSEIF

May 12, 2020 by Lee Lazarow Leave a Comment

Tips & Tricks

Most of you know the concept of an IF statement within TurboIntegrator

IF (expression);
statement1;
ENDIF;

… and most of you also know the concept of nested-IF statements

IF (expression);
    statement1;
ELSEIF (expression);
    statement2;
ENDIF;

… and most of you also know the concept of generically using an ELSE command as a catch-all

IF (expression);
    statement1;
ELSEIF (expression);
    statement2;
ELSE;
    statement3;
ENDIF;

But did you know that Planning Analytics has a maximum number of nests that can be included within a TurboIntegrator process?  You can nest up to 20 ELSEIF/ELSE statements in a process. If you exceed 20 nested statements then you will receive an error when attempting to save the process.

If you come across situations where you are using a lost of nested IF statements, then there may be a way to re-assess the expressions that are being used.  Give us a call!

IBM Planning Analytics, which TM1 is the engine for, is full of new features and functionality. Not sure where to start? Our team here at Revelwood can help. Contact us for more information at info@revelwood.com. And stay tuned for more Planning Analytics Tips & Tricks weekly in our Knowledge Center and in upcoming newsletters! You can also sign up to get our Planning Analytics Tips & Tricks sent directly to your inbox!

Read more IBM Planning Analytics Tips & Tricks:

IBM Planning Analytics Tips & Tricks: Learn the Excel CELL Formula

IBM Planning Analytics Tips & Tricks: IFERROR

IBM Planning Analytics Tips & Tricks: Excel’s CONCAT and TEXTJOIN Functions

Home » Analytics » Page 5

Filed Under: IBM Planning Analytics Tips & Tricks Tagged With: Analytics, Financial Performance Management, IBM Cognos TM1, IBM Planning Analytics, lee lazarow, Planning Analytics Tips & Tricks, Revelwood, TM1

Tech Bulletin: New IBM Planning Analytics Features for 2020

May 11, 2020 by Lee Lazarow Leave a Comment

Tech Bulletins

IBM introduces new features for Planning Analytics in releases throughout the year. We publish IBM Planning Analytics Tips & Tricks on these features every Tuesday in our Knowledge Center. If you would like to receive these in your inbox every Tuesday, you can subscribe here.

Here we list out which useful features have been released so far this year for PAx and PAW.

New PAx Features in 2020

2.0.50 (Feb)
Design Mode can be used to enable or disable the refreshing of an Exploration View upon every change. As of 2.0.50, you can now also use Design Mode to preserve or clear DBRW formulas when you are copying and pasting values into cells.

2.0.51 (Mar)
As of version 2.0.51, you can now bulk update the data source or package for multiple Exploration Views at the same time.

2.0.52 (Apr)
Various improvements were made to the set editor to make it easier to work with large dimensions. These include the ability to focus on one area at a time, have easy access to various functions, perform drag and drop functionality, and define default settings for the available members and current set panes.

New PAW Features in 2020

2.0.48 (Jan)
Ability to abbreviate numbers to thousands or millions within the Set Format options

2.0.49 (Feb)

  • Changed hierarchy sorting to an alphabetical approach
  • Ability to enable security access to processes

2.0.50 – 2.0.52 (Apr)

  • Set editor improvements (see Pax 2.0.52 for details)
  • The AgentActions.log file can be used to review the user and time associated with these database actions: start, stop, restart, and end process
  • Modified various icons and the settings within the refresh menu

If you have any questions about these features, please feel free to reach out to me at llazarow@revelwood.com.

Home » Analytics » Page 5

Filed Under: Tech Bulletins Tagged With: Analytics, Financial Performance Management, IBM Cognos TM1, IBM Planning Analytics, TM1

FP&A Done Right: The Office of Finance in the COVID-19 Economy

May 8, 2020 by Lisa Minneci Leave a Comment

FP&A Done Right

Three months ago, we could not have imagined life as it is today. We’re experiencing an economic slowdown that none of us have seen before. Not a single industry is immune from the impact of the U.S. and other countries sheltering-in. Many businesses and industries are down, decimated and are temporarily or permanently closed. Others, like those in the streaming and video conferencing industries, online grocery shopping and third-party restaurant delivery services are booming.

This volatility puts tremendous pressure – both in the form of threats and opportunities – on the CFO and the Office of Finance. There are many questions facing the CFO. Let’s take a look at what some recent reports indicate, and how CFOs and the Office of Finance can arm themselves to be better positioned to respond to both the threats and the opportunities presented by today’s market.

CFOs’ Concerns

CFOs are concerned with the potential length of this downturn.  CFO surveyed financial executives and found that they are taking immediate financial action to “survive revenue and profit impacts.” More than half of these executives are estimating a drop in sales between 1 – 20% in the first quarter of 2020. But on a positive note, 46% said they expected a “V-shaped recovery.”

The Office of Finance in the COVID-19 Economy

McKinsey & Company recently wrote about The CFO’s Role in Helping Companies Navigate the Coronavirus Crisis. In it, they state,

“The CFO can play a strong, central role, alongside executive peers, in stabilizing the business and positioning it to thrive when conditions improve … The CFO is the leader, after all, who most directly contributes to a company’s financial health and organizational resilience day to day.”

CFO reports their second concern was cash flow. This is critical, but not unmanageable. This is where the Office of Finance plays a central role in helping the organization survive. Your 2020 budget, plan, and forecast are all irrelevant now.  You need to adjust your forecast to give an accurate financial outlook to senior management and investors. Your forecast must reflect new operational metrics for changes in production facilities, staffing and purchasing. It is imperative to change your forecast to show long-term plans for banks and other lenders.

To do that you need to understand what your business model looks like now. Not what it did when you put together your original FY2020 forecast. But what it looks like today, with schools, malls and restaurants closed, production lines stopped or transformed into making PPE, shipments delayed, and vital parts of our supply chains overwhelmed.

Do you have an accurate understanding of your model? The time to act is now. The business environment is uncertain now, and it’s impossible to predict what the next few quarters will look like – regardless of your industry, size, or location.

Home » Analytics » Page 5

Filed Under: FP&A Done Right Tagged With: Analytics, coronavirus, COVID-19, FP&A, FP&A done right, Revelwood

IBM Planning Analytics Tips & Tricks: New Excel Feature – Map Charts

May 5, 2020 by Dillon Rossman Leave a Comment

Tips & Tricks

One of the new features in Excel is the ability to create Map Charts to compare values and show categories across geographical regions.

If you have your own set of data to use skip to step 3. Otherwise, we can accomplish this in a few easy steps using one of Excel’s preset geographical data types:

  1. Once you have your list of geographical values, navigate to the Data Tab > Data Types > Geography.IBM Planning Analytics Tips & Tricks:New Excel Feature - Map Charts
  2. An option to insert data will appear. This will offer several preset options that will be automatically populated once selected.IBM Planning Analytics Tips: New Excel Feature - Map Charts
  3. Now that data is populated the Map Chart can be created. Highlight your table, navigate to the Insert Tab > Charts > Maps > Filled Map. A Map Chart will now be createdIBM Planning Analytics Tricks: New Excel Feature - Map Charts

This is a nifty feature in Excel that will help visualize your data. Remember, this feature is already built-in to Planning Analytics Workspace! Learn more about this in our earlier blog post on displaying data in maps.

IBM Planning Analytics, which TM1 is the engine for, is full of new features and functionality. Not sure where to start? Our team here at Revelwood can help. Contact us for more information at info@revelwood.com. And stay tuned for more Planning Analytics Tips & Tricks weekly in our Knowledge Center and in upcoming newsletters!

Read more IBM Planning Analytics Tips & Tricks:

IBM Planning Analytics Tips & Tricks: Sparklines

IBM Planning Analytics Tips & Tricks: Visualizing Data in Pie Charts

IBM Planning Analytics Tips & Tricks: Creating a Simple Dashboard in Planning Analytics Workspace

Home » Analytics » Page 5

Filed Under: IBM Planning Analytics Tips & Tricks Tagged With: Analytics, Budgeting Planning & Forecasting, Financial Performance Management, IBM Cognos TM1, IBM Planning Analytics, Planning & Forecasting, Revelwood, TM1

IBM Planning Analytics Tips & Tricks: Sparklines

April 28, 2020 by Dillon Rossman Leave a Comment

Tips & Tricks

Are you familiar with Sparklines, a rarely used feature in Excel?

What happens when you’d like to provide a visual representation of data but don’t necessarily want, or have the space, for a big chart? Sparklines may be a viable solution.

To add a Sparkline for data, follow these steps:

  1. Once you have your data, navigate to the Insert Tab > Sparklines. In this scenario a Line Sparkline will be used but there are also options for Column and Win-Loss Sparklines.IBM Planning Analytics Tips & Tricks: Sparklines
  2. Once selected, a dialogue box will show two fields:
    1. A. Data Range – Data that will appear in the Sparkline
    2. B. Location Range – Where the Sparkline will be placed
      Learn how to use Sparklines in IBM Planning Analytics
  3. After filling out the necessary fields, a Sparkline will be created, and the Sparkline Tab will appear. This provides several options to change the appearance of a Sparkline.sparklines in IBM planning analytics

Implementing Sparklines is a very easy and effective way to visualize data without the need for charts.

IBM Planning Analytics, which TM1 is the engine for, is full of new features and functionality. Not sure where to start? Our team here at Revelwood can help. Contact us for more information at info@revelwood.com. And stay tuned for more Planning Analytics Tips & Tricks weekly in our Knowledge Center and in upcoming newsletters! You can also sign up to get our Planning Analytics Tips & Tricks sent directly to your inbox!

Read more IBM Planning Analytics Tips & Tricks:

IBM Planning Analytics Tips & Tricks: New Configuration Setting for Dates

IBM Planning Analytics Tips & Tricks: New Parameters for TurboIntegrator

IBM Planning Analytics Tips & Tricks: The New Set Editor

Home » Analytics » Page 5

Filed Under: IBM Planning Analytics Tips & Tricks Tagged With: Analytics, Budgeting, Budgeting Planning & Forecasting, Financial Performance Management, IBM Cognos TM1, IBM Planning Analytics, Planning & Forecasting, Planning & Reporting, Planning Analytics Tips & Tricks, TM1

IBM Planning Analytics Tips & Tricks: Bulk Load Template for Cubes with Indices

April 21, 2020 by Thanh Chau Leave a Comment

Tips & Tricks

Do you have cubes in your IBM Planning Analytics (PA) model that allow for planning with line item detail? The struggle you may come across in creating a template in Excel that automatically loads to the next available line is that such a template will either not allow you to load in bulk or requires you to load to only one center or account combination at a time. Using PA’s Quick Report, you can create an input template that solves both obstacles.

In implementing a Quick Report load template solution, you must include a Count measure in your cube to track which indices are currently used.

IBM Planning Analytics Tips & Tricks: Bulk Load Templates for Cubes with Indices

Create your Quick Report so that the Index dimension and other dimensions that constitute a unique index row are in the rows and the other dimensions are in the columns. In the example below, every new item entered for a center will require its own index row. The Measure, Version, and Time dimensions are in the columns.

IBM Planning Analytics Tips: How to Bulk Load Cubes with Indices

In the first row, hard-code a dummy line that will not be included in reporting or will not receive any inputs. The reason for this is that a Quick Report always needs at least one data row to maintain the connection to the cube. You can format this row and change the row height to have it appear as a thick border to your users.

IBM Planning Analytics Tricks: Bulk Load Templates for Cubes with Indices

Lastly, for every row that you’d like to be a part of the load area, populate the Index column with a formula that will determine the next row number by pulling the Count measure of “Total Index” for the center, adding the number of times the center appears in the rows above the current row, and add one to increment to the next index.

You can hide the Index column as this column will no longer be controlled by the user.

IBM Planning Analytics, which TM1 is the engine for, is full of new features and functionality. Not sure where to start? Our team here at Revelwood can help. Contact us for more information at info@revelwood.com. And stay tuned for more Planning Analytics Tips & Tricks weekly in our Knowledge Center and in upcoming newsletters! You can also sign up to get our Planning Analytics Tips & Tricks sent directly to your inbox!

Read more IBM Planning Analytics Tips & Tricks:

IBM Planning Analytics Tips & Tricks: Clearing all Data from a Cube

IBM Planning Analytics Tips & Tricks: Cellput vs CellIncrement

IBM Planning Analytics Tips & Tricks: When to Build Multiple Cubes

Home » Analytics » Page 5

Filed Under: IBM Planning Analytics Tips & Tricks Tagged With: Analytics, Budgeting, Budgeting Planning & Forecasting, Financial Performance Management, IBM Cognos TM1, IBM Planning Analytics, Planning & Forecasting, Planning & Reporting, TM1

FP&A Done Right: Spreadsheets are Outdated

April 17, 2020 by Revelwood Leave a Comment

FP&A Done Right

This is a guest blog post from our partner Workday Adaptive Planning, written by Adaptive Insights’ Founder Rob Hull. It was originally published on FEI Daily.

The global marketplace is moving faster, requiring companies to be more agile than ever in this age of urgency. Yet businesses—and specifically finance teams—still rely on tools that sustained them decades ago. Those tools were designed for an age when planning was an annual, top-down and linear process, but today we no longer have the luxury of devoting an average of 77 days to develop an annual plan. Change is continuous, so planning must be too.  And it must also be more collaborative.

The rapid change in our technological ecosystem is causing a growing number of finance chiefs to tell their staff to find tools better suited to modern business planning and analysis than spreadsheets — for decades the default planning application for virtually every business. The inconveniences of spreadsheets for planning and analysis, such as version control errors stemming from manual data entry, clumsy email collaboration, and the challenges of creating a single source of truth from disparate data sources can now be a distant memory thanks to modern planning tools. As Bernard Marr observed in Forbes, spreadsheets may still be a great choice for some tasks, but not for the kind of agile planning and analytics required in today’s fast paced business environment.

From the cloud, a different way to plan

These and other observers have pointed to the rise of cloud-based planning software that has taken the fundamental capabilities of the noble spreadsheet and turned them into something that spreadsheets never quite managed to be – automated, intuitive, collaborative, integrated, multi-dimensional, and always up to date. Just as cloud-based CRM applications like Salesforce.com replaced legacy applications like Siebel, so too are cloud planning solutions replacing spreadsheets and legacy applications to provide much needed agility in today’s era of urgency.

Spreadsheets are a wonderful personal productivity tool, and as such will continue to have a place among business applications. But for company-wide finance, sales, and workforce planning, reporting and analysis, the future will look different than the past.

The future of planning is unfolding

With the advancement in technology, we’re starting to see menial tasks accomplished through automation, making time for teams to spend on high value tasks. Finance execs report that, on average, 83 percent of their staff’s time is spent on manual, menial tasks like data input and consolidation. That’s lost time that could be converted to more valuable and strategic tasks with better tools for planning, reporting and analysis.

Pinsent Masons LLP, a UK-based law firm with offices throughout Europe, the Middle East, Africa, Asia, and Australia, found that swapping out spreadsheets for cloud-based planning, reporting and analysis helped automate previously manual tasks, freeing finance staff to be more strategic. “We spent 70 percent of our time entering and verifying data, and 30 percent viewing and interpreting it,” notes Andrew Brett, who heads financial reporting at Pinsent Masons. “We now can spend seven out of every 10 hours gleaning insight from our data.”

Meanwhile, anytime, anywhere access and intuitive application design make planning far more collaborative. Spreadsheets are great for individual users, but in small groups, they’re less great and in large groups, they’re abysmal. On the other hand, cloud solutions were built for collaboration. They allow any authorized participant to work on a plan, from anywhere, at any time. Better still, you’ll always know who made changes and when. Leading cloud vendors have introduced intuitive planning interfaces that make it easy for non-finance personnel to collaborate, enter data, create reports, and run what-if scenarios because they recognize that in business, everybody plans.

Organizations that make the digital transformation leap for planning will see gains in scale and speed. The spreadsheet wasn’t built for enterprise scale, but the cloud was – modern cloud-based planning solutions can support thousands of concurrent users and highly complex multi-dimensional models. Modern solutions are also built to address the performance demands of enterprises. The most advanced cloud planning software solutions use powerful modeling engines that add memory and compute resources when needed and remove the data limits finance pros have come to despise.

Teams can also access data from every corner of the business. Manually importing enterprise data into spreadsheets can be complicated and troublesome — and that’s being polite. In contrast, the best cloud platforms automatically integrate data from your ERP, HCM, CRM and other transactional data sources so that you can refresh data with a single click and know you are working with the latest information.

Mind the gap

There’s a dangerous gap that can emerge when companies rely on outdated processes while their competitors embrace new, more agile ways of working. Agile teams produce market-leading results. The gap yawns even wider for companies still relying on tools developed for the way businesses operated before the internet changed…well, everything.

Holistic company-wide planning isn’t the pipe dream it once was – it’s now a business imperative and it’s the key to unlocking the kind of agility that turns planning into a competitive advantage. Realizing this, more and more execs are coming to the same conclusion: On the journey to the future, spreadsheets for business planning have become as archaic as the Rolodex.

Rob Hull is the founder of Adaptive Insights, a Workday company. Rob had a vision to provide modern finance leaders with an easy-to-use SaaS-based solution to manage business performance. Today that vision is a reality for thousands of businesses around the world.

This post also appeared on the Workday Adaptive Planning blog.

Read additional FP&A Done Right blog posts from our partner Adaptive Insights:

FP&A Done Right: Can you Recover from Static Planning?

FP&A Done Right: How to Improve your Financial Reporting Process

FP&A Done Right: 3 Barriers to Business Agility

Home » Analytics » Page 5

Filed Under: FP&A Done Right Tagged With: Adaptive Insights, Analytics, Budgeting, Budgeting Planning & Forecasting, Financial Performance Management, FP&A, FP&A done right, Planning & Forecasting, Planning & Reporting, Revelwood, Rob Hull, spreadsheets

Revelwood Offers Adaptive Insights Training Online

April 16, 2020 by Lisa Minneci Leave a Comment

News & Events

Get the most out of your Adaptive Insights implementation by taking Adaptive Insights training from our award-winning team. Our seasoned, Adaptive-certified instructors ensure you get the technical skills you need to excel with Adaptive Insights.

We offer a range of courses – for the new Adaptive Insights user to experienced Adaptive Insights users looking to take the next step in planning and reporting.

Our current Adaptive Insights training courses are:

Introduction to Adaptive Planning & Reporting

This course introduces new users to Adaptive Planning. You’ll learn Adaptive basics, including:

  • How to navigate throughout the application
  • Structure design element basics
  • How to create an Operating Expense sheet and enter a budget into it
  • Models & Cubes, Users & Roles, Basic Formulas, Basic Reports, and more

Adaptive Reporting

We’ve designed this course for both new users and intermediate users who want to learn about the reporting features in Adaptive Planning. You’ll learn:

  • How to use the matrix report builder
  • How to design a P&L report
  • How to create a version comparison report
  • How to use conditional formatting and display options, and more

Introduction to Office Connect

If you have minimal experience with the Office Connect application, then this is the course for you! You’ll learn:

  • Office Connect terminology and navigation
  • How to create an Office Connect report that is dynamically linked to Adaptive Planning
  • How to work with relative and static time-elements, enabling the creating of rolling period reports
  • How to link selected elements from an Excel report to matching Adaptive Planning data, and more

We offer two different options for these online courses. The first option is a four and a half hour long, fully interactive course. In order to participate in this, your company must have access to the Adaptive Insights eLearning program. The second option is an online, three-hour, view-only course. This course is open to everyone.

Check out our class schedule to find a convenient time for you to hone your Adaptive Insights skills!

Home » Analytics » Page 5

Filed Under: News & Events Tagged With: Adaptive Insights, Adaptive Insights training, adaptive planning training, Analytics, Budgeting, Budgeting Planning & Forecasting, Financial Performance Management, Planning & Forecasting, Planning & Reporting, Revelwood

  • « Go to Previous Page
  • Page 1
  • Interim pages omitted …
  • Page 3
  • Page 4
  • Page 5
  • Page 6
  • Page 7
  • Interim pages omitted …
  • Page 26
  • Go to Next Page »

Footer

Revelwood Overview

Revelwood helps finance organizations close, consolidate, plan, monitor and analyze business performance. As experts in solutions for the Office of Finance, we partner with best-in-breed software companies by applying best practices guidance and our pre-configured applications to help businesses achieve their full potential.

EXPERTISE

  • Workday Adaptive Planning
  • IBM Planning Analytics
  • BlackLine

ABOUT

  • Who We Are
  • What We Do
  • How We Help
  • How We Think
  • Privacy

CONNECT

World Headquarters

Florham Park, NJ | 201 984 3030

European Headquarters

London & Edinburgh | +44 (0)131 240 3866

Latin America Office

Miami, FL | 201 987 4198

Email
info@revelwood.com

Copyright © 2025 · Revelwood Inc. All rights reserved. Revelwood® and the Revelwood logo are registered marks of Revelwood Inc.