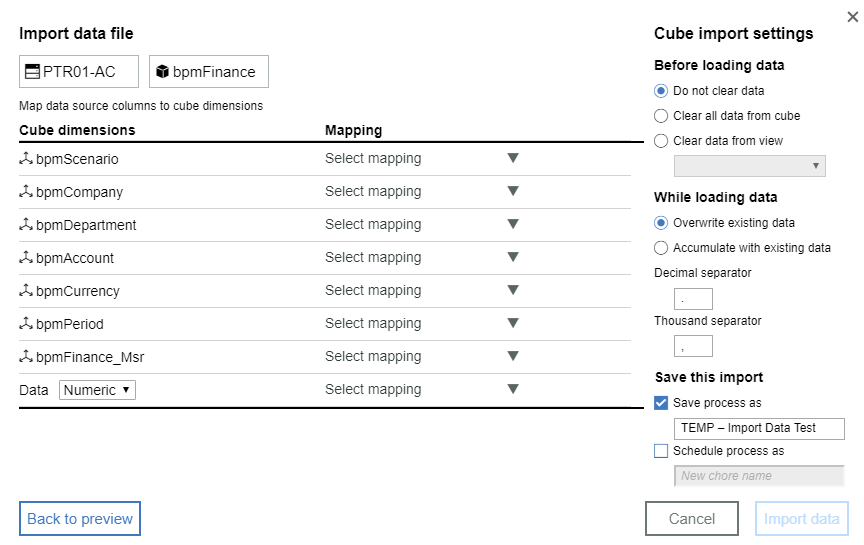
When working with IBM Planning Analytics templates in Excel, there may be instances where you need to change the instance that the cube references to pull or send data. In Perspectives, updating the source was as simple as updating the first parameter of the DBRW or DBRA formulas. However, Quick Reports do not use formulas so there is a different approach to update the connection.
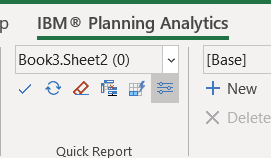
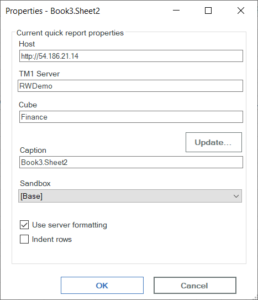
In the Quick Reports section of the Planning Analytics ribbon, click on the Properties icon.
In the top section of the resulting window, you will see the connection detail for the selected Quick Report. Click the Update button to make changes to the connection.
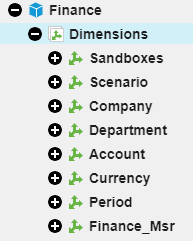
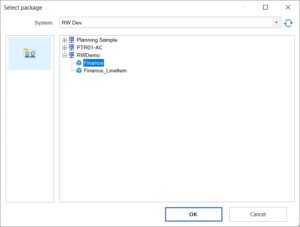
In the next window, select the Admin Host from the dropdown menu at the top labeled “System”. Expand the instances to view the cubes available in that instance and select the cube you want to use as the new source. When you click OK, the source will be updated.
This approach offers an easy way to use the same files across multiple environments.
IBM Planning Analytics, which TM1 is the engine for, is full of new features and functionality. Not sure where to start? Our team here at Revelwood can help. Contact us for more information at info@revelwood.com. And stay tuned for more Planning Analytics Tips & Tricks weekly in our Knowledge Center and in upcoming newsletters! You can also sign up to get our Planning Analytics Tips & Tricks sent directly to your inbox!
Read more IBM Planning Analytics Tips & Tricks:
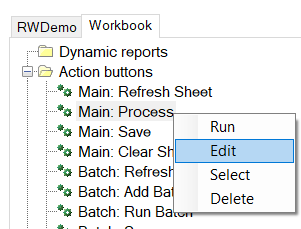
IBM Planning Analytics Tips & Tricks: Edit Action Button
IBM Planning Analytics Tips & Tricks: Bulk Load Template for Cubes with Indices