• Skip to main content
  • Skip to footer
Revelwood Logo

Revelwood

Your SUPER-powered WP Engine Site

  • Who We Are
    • About Us
      • Our Company
      • Our Team
      • Partners
    • Careers
      • Join Our Team
  • What We Do
    • Solutions
      • Workday Adaptive Planning
      • IBM Planning Analytics
      • BlackLine
    • Services
      • Implementation Services
      • Customer Care
        • Help Desk
        • System Administration as a Service
      • Training
        • Workday Adaptive Planning Training
        • IBM Planning Analytics / TM1 Training
    • Products
      • DataMaestro
      • LightSpeed
      • IBM Planning Analytics Utilities
  • How We Help
    • Use Cases
    • Client Success Stories
  • How We Think
    • Knowledge Center
    • Events
    • News
  • Contact Us

Budgeting Planning & Forecasting

IBM Planning Analytics Tips & Tricks: The Waterfall Chart

January 19, 2021 by Lee Lazarow Leave a Comment

IBM Planning Analytics Workspace (PAW) includes various visualizations that can be used to view your data. One of these visualizations entails a chart called a waterfall chart. This type of chart will help you show the components of a summarized number and is very helpful in determining which values are beneficial to the total and which values are detrimental.

The image below shows an exploration and its corresponding waterfall chart.

IBM Planning Analytics Tips & Tricks: The Waterfall Diagram
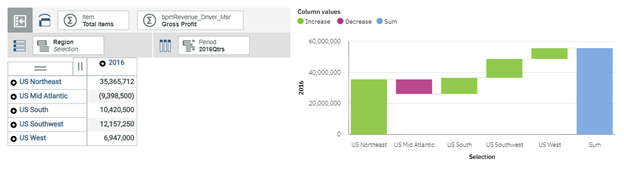
  • The chart shows information about each region while also defining each region as a positive (green) or negative (red) amount, which makes it easy to determine what is adding to the total and what is reducing the total.
  • The chart makes it easy to compare regions against each other, which allows you to quickly see that the Northeast gross profit is much larger than the West.
  • The chart allows users to look at the pieces as a rough percentage of the total, which lets you see that the Northeast accounts for more than half of the total.

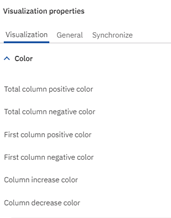
PAW also allows you to customize various aspects of the chart, including colors for each bar.

Understanding the waterfall diagram in IBM Planning Analytics

The combination of an exploration and a waterfall chart can be used as the starting point for a user friendly dashboard in PAW.

IBM Planning Analytics, which TM1 is the engine for, is full of new features and functionality. Not sure where to start? Our team here at Revelwood can help. Contact us for more information at info@revelwood.com. And stay tuned for more Planning Analytics Tips & Tricks weekly in our Knowledge Center and in upcoming newsletters!

Read more IBM Planning Analytics Tips & Tricks:

IBM Planning Analytics Tips & Tricks: IBM Planning Analytics Workspace Chart Types

IBM Planning Analytics Tips & Tricks: Visualizing Data into Pie Charts

IBM Planning Analytics Tips & Tricks: Hiding Dimensions in Planning Analytics Workspace

Home » Budgeting Planning & Forecasting » Page 9

Filed Under: IBM Planning Analytics Tips & Tricks Tagged With: Budgeting Planning & Forecasting, Financial Performance Management, IBM Cognos TM1, IBM Planning Analytics, IBM Planning Analytics Workspace, lee lazarow, Planning Analytics tips, Planning Analytics Tips & Tricks, Planning Analytics Workspace, Revelwood, TM1

FP&A Done Right: xP&A and Modern Finance Planning

January 15, 2021 by Revelwood Leave a Comment

This is a guest blog post from our partner Workday Adaptive Planning, written by Matt Shore. Shore, vice president and product strategist, explains xP&A and why it matters.

xP&A stands for extended planning and analysis—taking the best of modern finance planning and extending it across the enterprise. But it’s not new. For years, it has been known as company-wide planning.

Finance leaders whose organizations have been made more agile and strategic with modern planning and analysis have known for years that their approach to planning can transform other parts of the business. Now, as they work to recover from the global COVID-19 pandemic, that awareness is more valuable than ever.

Growing recognition around expanding the use of FP&A best practices beyond finance recently earned an industry imprimatur from Gartner, whose 2020 Strategic Roadmap for Cloud Financial Planning and Analysis Solutions report said, “By 2024, 70% of new financial planning and analysis projects will become extended planning and analysis (xP&A) projects, extending their scope beyond the finance domain into other areas of enterprise planning and analysis.”*

We agree that bringing continuous, comprehensive, and collaborative planning to every part of an enterprise has not only arrived, it’s ascendant.

We’ve been advocating the concept since back when we began working with customers to harness the platform and processes of modern planning from financial planning to sales, workforce, and operational planning. Our solutions for enterprise planning are defined by powerful automation, enterprise-class scalability, intelligent planning assisted by machine learning, always-on cloud availability, and award-winning ease of use.

These requirements have essentially served as design standards for planning solutions from Workday, where we’ve always believed that the promise of enterprise planning can only be realized by linking finance and operations in a holistic and seamless way.

Extended planning, orchestrated by finance

Finance is the natural steward of enterprise data, so it makes sense that finance should orchestrate company-wide planning. According to Gartner, “The office of finance is uniquely positioned to drive continuous company-wide financial planning and analysis (FP&A) initiatives. Finance’s connection to all other business domains means that these initiatives will be capable of driving higher-quality decisions and outcomes.”*

In fact, Gartner says, “By 2024, 50% of new financial planning and analysis implementations, upgrades and replacements will be sourced from core financials vendors, due to superior integration and product bundling.”*

This capability has never been more critical. For operations, where plans are generally refreshed more frequently and based on greater volumes of data, understanding the financial impact of every decision can ultimately mitigate the risk of executing those decisions. And seamless access to current operational data and actuals can also improve the confidence of the C-suite in the firm’s business projections. And these days, who doesn’t need a bit more confidence?

Company-wide planning done right: Meeting the needs of xP&A

Developing a solution for planning across the enterprise isn’t a small undertaking. It requires three fundamental capabilities.

A flexible and scalable modeling platform

Those who’ve built models with traditional planning software are accustomed to limits on dimensions, or they know too well the experience of waiting (and waiting) on results. To solve this, and to enable modeling at enterprise scale, we developed Elastic Hypercube Technology—our groundbreaking, patent-pending modeling engine that doesn’t force organizations to make compromises that slow insight or limit the number of scenarios a team can evaluate. For company-wide planning, this means creating models for virtually any kind of functional use. You can model and plan at the work-group level and then combine those plans into a comprehensive, holistic model of the business. It’s modeling for an xP&A world.

The ability to seamlessly plan-execute-analyze business processes

Planning isn’t done in a vacuum, particularly in an xP&A context. For true company-wide planning, plans must be integrated to gain a comprehensive view of the business. Our federated planning architecture enables each function or business unit to have its own planning instance while preserving the ability to bring all the pieces together into a holistic plan. With federated planning, a change to one plan automatically updates all related plans. This architecture also makes it easy to dovetail planning with the applications organizations use to execute those plans (such as financial management or human capital management solutions), and then analyze data and results to support faster, smarter decision-making. Company-wide planning also requires a single source for truth, with plans and applications sharing the same data across planning and execution, just as Workday applications do today. As Gartner notes, “Suite-based applications consume data from a single source and share the same metadata and master data. This means that overall company-wide financial reporting and governance is substantially enhanced.”*

Easy adoption and use

Traditional planning platforms are notoriously difficult to implement and use. This has kept them locked away in the office of finance, their complex environments all but dooming them to be used by just a handful of highly trained analysts. For xP&A to take root in the form of company-wide planning, it was necessary to recognize that in business, everybody plans. So planning has to be easy. Here’s just one way we’ve improved ease of use: Active dashboards, announced at Adaptive Live earlier this year, blend driver-based planning with interactive analytics to help users assess the impact of their changes in real time. And rich data access rules ensure administrators can be very specific about what data users can view or edit, making it that much easier to safely enable more stakeholders to be active participants in company-wide planning.

The journey to company-wide planning: xP&A in action

For most companies, the journey to company-wide planning begins in finance. Many companies, after seeing the success they’ve had there, expand planning to other departments like HR for workforce planning and sales for sales planning, with both plans linked back to the corporate model. This federated planning environment allows each entity and function to plan the way it needs to, but all plans are seamlessly connected to a holistic corporate plan. This helps create a more agile, competitive organization where decisions are made based on insight rather than instinct.

Customer surveys show that Workday Adaptive Planning customers are prime examples that company-wide planning is indeed the future. Demonstrating classic use cases for xP&A, they’ve extended their modern planning environment into areas as varied as inventory and shop floor space planning, sales rep ramp modeling, and product pricing planning. Many others are using our workforce planning solution to model their optimal workforce, and still more are relying on their planning environment to design a return-to-work strategy at a time of unprecedented disruption.

Take Rubrik, a rapidly growing global provider of cloud-based data management and protection solutions. Rubrik initially deployed Workday Adaptive Planning in finance to streamline budgeting and accelerate quarterly close. Building on that success and to achieve a more accurate and timely top-line plan, the company extended its use of Workday Adaptive Planning to sales finance and sales operations to automate bookings, improve seller capacity and productivity, and plan and manage territories and quotas.

Ajay Sabhlok, vice president of IT business applications at Rubrik, describes the company’s xP&A pivot to company-wide planning as a significant step forward.

“To automate planning in a comprehensive manner across the company,” says Sabhlok, “is setting the foundation for growth.”

In the end, that’s what company-wide planning is all about. In a world where the future is harder and harder to predict, agility is everything. As thousands of Workday customers already know and as many more throughout the industry are coming to realize, finance is showing the entire enterprise how to plan for what’s next. No matter what you call it—xP&A, company-wide planning, or something else—one thing is certain. This is the future of planning.

*Gartner, 2020 Strategic Roadmap for Cloud Financial Planning and Analysis Solutions, Robert Anderson, John Van Decker, 21 February 2020.

This blog post was originally published on the Workday Adaptive Planning blog.

Read more guest posts from Workday Adaptive Planning:

FP&A Done Right: Three Steps to Help you Plan for What’s Coming

FP&A Done Right: Can you Recover from Static Planning?

FP&A Done Right: Planning for What’s Next in Uncertain Times

Home » Budgeting Planning & Forecasting » Page 9

Filed Under: FP&A Done Right Tagged With: Adaptive Insights, Budgeting Planning & Forecasting, company-wide planning, enterprise performance management, Financial Performance Management, Workday Adaptive Planning, xP&A

IBM Planning Analytics Tips & Tricks: Convert Existing View Directly to Reports

November 24, 2020 by Revelwood Leave a Comment

Did you know that Planning Analytics for Excel (PAx) provides the ability to convert an existing view directly to a report in Excel? Without opening the view as an Exploration, you can start building your report directly from the Task Pane.

Just right-click on the view in the Task Pane to display the available options.

IBM Planning Analytics Tips & Tricks: Convert Existing View to Reports

You will see the following options by hovering over the Quick report, Dynamic report, and Custom report items:

How to convert existing views into reports in Planning Analytics

In this example, each of the items does the following:

  • On this sheet: This will open the existing Planning Analytics view as a Quick report on the current Excel sheet at cell $A$1.
  • On new sheet: This will open the view as a Quick report on a new sheet at cell $A$1.
  • At current location: This will open the view as a Quick report at the cell that is currently active.
  • At specified location: This will open a pop-up window that allows you to input the cell at which you would like the Quick report to appear. You can then enter the cell address and click OK to generate the Quick report, as shown in the following image.
Learn how to convert existing views to reports in Planning Analytics

IBM Planning Analytics, which TM1 is the engine for, is full of new features and functionality. Not sure where to start? Our team here at Revelwood can help. Contact us for more information at info@revelwood.com. And stay tuned for more Planning Analytics Tips & Tricks weekly in our Knowledge Center and in upcoming newsletters! You can also sign up to get our Planning Analytics Tips & Tricks sent directly to your inbox!

Read more IBM Planning Analytics Tips & Tricks posts:

IBM Planning Analytics Tips & Tricks: PAx Task Pane Workbook Tab

IBM Planning Analytics Tips & Tricks: PAx Control Objects

IBM Planning Analytics Tips & Tricks Video: Using Drag & Drop to Change Selector Elements in PAx Reports

Home » Budgeting Planning & Forecasting » Page 9

Filed Under: IBM Planning Analytics Tips & Tricks Tagged With: Analytics, Budgeting, Budgeting Planning & Forecasting, Financial Performance Management, IBM Cognos TM1, IBM Planning Analytics, Nina Gordy, Planning & Forecasting, Planning & Reporting, Planning Analytics tips, Planning Analytics Tips & Tricks, TM1

IBM Planning Analytics Tips & Tricks: PAx Task Pane Workbook Tab

November 17, 2020 by Revelwood Leave a Comment

Did you know that Planning Analytics for Excel (PAx) automatically keeps track of the Planning Analytics objects you have open in an Excel workbook?

Simply click on the Workbook tab of your Task Pane to view the list of Dynamic reports, Action buttons, Explorations, and Quick reports that are currently in use.

IBM Planning Analytics Tips & Tricks: PAx Task Pane Workbook Tab

These folders will be populated as you work with your Planning Analytics environment. Whether you manually add these items to a worksheet, or they are included in an existing view or report, they will appear here.

For example, clicking the Exploration button in the PAx ribbon will create an Exploration on a new worksheet.

The PAx task pane workbook tab in IBM Planning Analytics

This will also add an item to the Explorations folder on the Workbook tab of the Task Pane. When you right-click on the name of the new Exploration, you will see the following options:

Learn about the PAx task pane workbook tab in IBM Planning Analytics

Similar options appear for Dynamic reports, Action buttons, and Quick reports.

IBM Planning Analytics, which TM1 is the engine for, is full of new features and functionality. Not sure where to start? Our team here at Revelwood can help. Contact us for more information at info@revelwood.com. And stay tuned for more Planning Analytics Tips & Tricks weekly in our Knowledge Center and in upcoming newsletters! You can also sign up to get our Planning Analytics Tips & Tricks sent directly to your inbox!

Read more IBM Planning Analytics Tips & Tricks:

IBM Planning Analytics Tips & Tricks: PAx Control Objects

IBM Planning Analytics Tips & Tricks: New PAx Features – Double Click

IBM Planning Analytics Tips & Tricks Video: Using Drag and Drop to Change Selector Elements in PAx Reports

Home » Budgeting Planning & Forecasting » Page 9

Filed Under: IBM Planning Analytics Tips & Tricks Tagged With: Analytics, Budgeting, Budgeting Planning & Forecasting, Financial Performance Management, IBM Cognos TM1, IBM Planning Analytics, Nina Gordy, PAx, Planning & Forecasting, Planning & Reporting, Planning Analytics for Excel, Planning Analytics Tips & Tricks, TM1

FP&A Done Right: Five Tips for Budgeting in the Age of COVID

November 13, 2020 by Revelwood Leave a Comment

This is a guest blog post from our partner Workday Adaptive Planning, written by Gary Cokins. Cokins explains why traditional budgeting is not a fit for the volatility, complexity and uncertain times businesses face today.

The pandemic is causing boards of directors and C-suite executives to take a new look at net cash flow. Traditional budgeting is simply too slow and too rigid to keep up with the rapidly changing business environment caused by COVID-19. There is too much volatility, complexity, and uncertainty right now.

Gone are the days when budgets could be one-and-done—tied to a fixed point in time and too inflexible to adjust to quickly changing business opportunities and challenges. In today’s world, a startup can be up and running and profitable in three months and disrupt its competitors. Consider Uber and Airbnb as examples. If your company takes nearly as long to create an annual budget, which is typically out-of-date a few months later, it will be extremely difficult to fight off the upstarts or keep up with your established competitors.

The solution? A flexible and continuous budgeting and forecasting process, often referred to as a rolling financial forecast, that helps you anticipate change and focus on outcomes rather than outputs and that is derived from the drivers to determine planned spending.

Here are five tips to modernize your budget process:

1. Just say no to one-and-done

Now more than ever, December’s fiscal year-end numbers often bear little resemblance to July’s realities—meaning budgets and forecasts must become more streamlined, accurate, and responsive. Annual budgeting won’t go away, but spending weeks and months processing data and reconciling spreadsheets that are out of date soon after the consolidated master budget is published doesn’t cut it anymore.

Modern budget solution:

  • Increase the frequency of budgets and forecasts to reflect shifting business conditions
  • Make decisions and plans based on data-backed insights rather than old and stale information
  • Change how resources, employees, and assets are allocated throughout the year and how the budget incorporates real-time opportunities and challenges

2. Focus on business drivers, not cost centers

Traditional budgeting focuses on allocating resources to cost centers, but business objectives (projects, products, and service lines) result from end-to-end cross-functional processes across the org chart. So if you determine the level of resources and spend based on forecast demand, then budgets and rolling forecasts can reflect performance that is company-wide rather than specific to a cost-center department.

Modern budget solution:

  • Enable organization-wide access to reports and data, allowing everyone to have visibility into the enterprise’s performance, including into individual departments
  • Review forecasts against budgets to eliminate confusion among competing departments
  • Provide real-time information for the needed insights to support better decision-making at all levels of the organization
  • Use drivers to determine the level of needed capacity (i.e., types and numbers of employees) to match your supply of capacity with demand

3. Create rolling financial forecasts

More than ever, fluctuating market conditions make accurate forecasts of future demand load (e.g., customer orders and sales) extremely challenging. Rolling financial forecasts help manage investments or financing determined by cash flow. They provide visibility into business performance using time horizons that reflect the speed of your business.

Modern budget solution:

  • Generate rolling financial forecasts that accommodate real-time shifts in market conditions
  • Enable self-service reporting so everyone in the organization can measure their performance against company-wide KPIs
  • Help everyone in the organization understand the downstream effects of their resource allocation decisions

4. Look forward, not back

Most budgets and forecasts are outdated before you push “publish” or soon after. And some factors are impossible to take into account (natural disasters, pandemics, broken supply chains, work stoppages). The rearview-mirror orientation of traditional budgeting (e.g., last year’s actuals create this year’s budgets) often results in increased “actuals” as managers exhibit “use-it-or-lose-it” behavior by spending needlessly to attain their prior fiscal year budget. Traditional budgets can’t keep up with the speed of modern business. One needs to look forward through the windshield.

Modern budget solution:

  • Respond faster to shifts in market conditions with real-time access to financials
  • Adjust outdated budgets and forecasts as change occurs
  • Move leadership discussions toward insight, planning, and action, rather than using the budget as a cost control mechanism to punish those with unfavorable cost variances

5. Use the right tools for the job

Creating a budget process that keeps up with the pace of today’s business requires a comprehensive, collaborative, and continuous planning platform—one that gives you robust, accessible reporting and modeling capabilities; dashboards with indicators and their targets that provide visibility into overall company performance; and automated tools that streamline budgeting and forecasting processes.

Modern budget solution:

  • Enable comprehensive planning that aligns the actions and priorities of everyone across the organization around common KPIs
  • Create opportunities for collaboration by giving everyone access to the data they need and deserve
  • Adjust and update budgets and forecasts on a continuous basis so you can navigate volatile market conditions in real time

Don’t let traditional budgeting lock you into outdated assumptions and fixed targets. Those outdated targets handcuff managers when the organization changes directions. Some managers view the fiscal year budget as a “contract” that they will not deviate from to minimize unfavorable variances from their allotted cost center budget expenses. This short-term focus jeopardizes the longer-term view. The modern FP&A professional knows the truth: Aligning budgets and rolling financial forecasts with comprehensive plans lays the groundwork for proactive rather than reactive planning—a significant strategic advantage in today’s highly competitive environment.

This blog post was originally published by Workday Adaptive Planning and appeared here.

Read more guest blog posts from Workday Adaptive Planning:

FP&A Done Right: Three Driver-Based Budgeting Tips for CFOs When Change is Imminent

FP&A Done Right: Three Words for a COVID-19 World – “Flexible Budget Variance”

FP&A Done Right: Planning for What’s Next in Uncertain Times

Home » Budgeting Planning & Forecasting » Page 9

Filed Under: FP&A Done Right Tagged With: Adaptive Insights, Analytics, Beyond Budgeting, Budgeting, Budgeting Planning & Forecasting, enterprise performance management, Financial Performance Management, Rolling Forecasts, Workday Adaptive Planning

Workday Adaptive Planning Tips & Tricks: CAPEX Planning – Your Tool for Growth

November 11, 2020 by Mary Luchs Leave a Comment

CAPEX (capital expenditures) planning is a key feature in Workday Adaptive Planning and gives the Office of Finance and senior executives greater visibility into the company’s financial risk, while also providing a tool for measuring corporate growth. Before we go into the specifics of CAPEX in Adaptive Planning, let’s take a step back and get an understanding of CAPEX.

Capital Expenditures: Overview

Capital expenditures are expenditures within a company that are not expensed on the income statement. They are considered to be investments into the company. Companies with higher capital expenditures are said to be investing more heavily into the future of their organizations.

CAPEX to Operating Cash Ratio

The CAPEX to operating cash ratio analyzes a company’s ability to acquire long term assets using cash flows. In other words, it indicates how much of a company’s cash flows is going towards capital expenditures. It is a great tool for measuring a company’s emphasis on growth. A higher CAPEX to operating cash ratio is an indicator of high growth in a company. A company whose ratio is too high could be taking on too much financial risk. While it is beneficial to invest in CAPEX, overspending in this area can compromise a company’s ability to pay off debts or cover other operating expenses. It is vital for the Office of Finance to have accurate, up to date visibility into CAPEX data in order to assess the company’s level of risk and make appropriate adjustments.

CAPEX and Depreciation

Depreciation is important to consider for asset management, especially for companies who are putting a lot of money towards their assets in the form of capital expenditures. A company must consider how their CAPEX depreciates when looking at their assets. This is a helpful tool to consider:

CAPEX > Depreciation → Growing assets

CAPEX < Depreciation → Shrinking assets

Accumulated depreciation of capital expenditures is indicated on the Balance Sheet, so it is important to consider how this impacts the net income of the company. Depreciation reduces the taxable income of a company, which is impactful especially for companies in a high growth phase who are investing heavily in capital. In addition to the CAPEX to operating cash ratio, depreciation can also be considered when analyzing a company’s growth.

Capex Planning in Workday Adaptive Planning

In addition to having a basic balance sheet and a P&L sheet, you should create a CAPEX sheet in Adaptive Planning. The CAPEX sheet offers a more specific look at capital expenditures than the balance sheet and the P&L sheet, allowing for more targeted analysis. Generating a CAPEX sheet also allows you to drill into expenses and depreciation for budgeting and forecasting purposes on a more granular level.

CAPEX Planning in Workday Adaptive Planning

In conjunction with the balance sheet, the CAPEX sheet is important for budgeting cash and analyzing capital investments. In Adaptive Planning, the CAPEX model consists of calculated accounts in a modeled sheet. These calculated accounts include capital values and their coinciding depreciation accounts. Each modeled account is performing the same calculation based on the asset class selected by the user. Asset class is a text selector column based on the categories of capital expenditures that are specific to your business. Companies vary greatly in the ways that they calculate capital value and depreciation, but all businesses can benefit from CAPEX planning.

How to do CAPEX planning in Workday Adaptive Planning

Adding a CAPEX sheet to your Adaptive Planning implementation gives you a powerful tool for understanding the investments in your company. When you can analyze this data at a granular level, you can better assess if your company has too much financial risk, or if you are invested at an appropriate level.

The team at Revelwood has been recognized by Workday Adaptive Planning for our thought leadership in the space, commitment to our Workday Adaptive Planning practice, and our rapid achievements of milestones. Visit Revelwood’s Knowledge Center for our Workday Adaptive Planning Tips & Tricks or sign up here to get our Workday Adaptive Planning Tips & Tricks delivered directly to your inbox. Not sure where to start with Workday Adaptive Planning? Our team here at Revelwood can help! Contact us info@revelwood.com for more information.

Read more Workday Adaptive Planning Tips & Tricks:

Workday Adaptive Planning Tips & Tricks: Override Formulas in Sheets

Workday Adaptive Planning Tips & Tricks: Templates

Workday Adaptive Planning Tips & Tricks: Alternate Time Tree

Home » Budgeting Planning & Forecasting » Page 9

Filed Under: Workday Adaptive Planning Tips & Tricks Tagged With: Adaptive Insights, adaptive insights tips & tricks, Analytics, Budgeting, Budgeting Planning & Forecasting, CAPEX, enterprise performance management, Financial Performance Management, Workday Adaptive Planning, Workday Adaptive Planning Tips & Tricks

IBM Planning Analytics Tips & Tricks: Alternative Row Formats for Excel Reports

November 10, 2020 by Lee Lazarow Leave a Comment

Tips & Tricks

In the early days of computing, printers often used paper that had alternating white and green areas which allowed the reader to easily follow a line of text across the page. This was known as “green bar” paper.  While we no longer use this type of paper, the concept is still applicable for situations where your output contains many columns that are hard to follow.

You can create this approach by using alternate row formats within your Excel reports.  This is done by combining two Excel formulas:

  • The ROW formula returns the row number for a cell reference. For example, ROW(K5) returns the number 5 since the cell is in the 5th row of the spreadsheet.
  • The MOD formula returns the remainder of two numbers after division. For example, MOD(9,2) returns the number 1.

When combined, the following formula will result in either a 1 or a 0:

=MOD(ROW(cell),2)

From there, you can use conditional formatting to define the fill colors. If you are doing this in standard Excel, then you can copy the formula throughout the applicable area.  If you are doing this within a dynamic report, then you can use it within the formatting area.

This approach allows you to make your wide reports easier to read. This also means that you can recreate the green bar format while you pull out your dot matrix printer and watch classic movies such as Wargames!

IBM Planning Analytics, which TM1 is the engine for, is full of new features and functionality. Not sure where to start? Our team here at Revelwood can help. Contact us for more information at info@revelwood.com. And stay tuned for more Planning Analytics Tips & Tricks weekly in our Knowledge Center and in upcoming newsletters!

Read more IBM Planning Analytics Tips & Tricks posts:

IBM Planning Analytics Tips & Tricks: Learn the Excel CELL Formula

IBM Planning Analytics Tips & Tricks: Excel’s IFS Function

IBM Planning Analytics Tips & Tricks: Excel’s LET Function

Home » Budgeting Planning & Forecasting » Page 9

Filed Under: IBM Planning Analytics Tips & Tricks Tagged With: Budgeting, Budgeting Planning & Forecasting, Financial Performance Management, IBM Cognos TM1, IBM Planning Analytics, lee lazarow, Planning & Forecasting, Planning & Reporting, Planning Analytics Tips & Tricks, Revelwood, TM1

Workday Adaptive Planning Tips & Tricks: Override Formulas in Sheets

November 4, 2020 by Michelle Song Leave a Comment

If you want to write a formula in an account in Workday Adaptive Planning, but still want to give your team the ability to override the formula and enter different data, you can use Shared Formulas to achieve that.

The Shared Formulas function of Adaptive Planning allows users to write level-specific and version-specific formulas for GL and custom accounts. Below is a screenshot of the Shared Formula page in Adaptive.

Workday Adaptive Planning: Override Formula

First, you will select the version, account, and levels that you want to write the formula. Then, you will write the formula in the “Set formula” box. Before you save the formula, you can choose to reserve/remove the user edits in the account if any. If you reserve the user edits, the formula will not override cells that already have data and only perform the formula in the cells that are blank on sheets.

Workday Adaptive Planning: How to override formulas in sheets

You can use the “Import Shared Formulas” function to import/update the formulas in multiple accounts and levels at a time.

Overrding formulas in Workday Adaptive Planning

Unlike Master Formulas, shared formula values are not locked in sheets. You can override the formula with different data directly in a sheet cell. In the example below, I overridden the formula for account 1110 Petty Cash in Mar 2019 with a different number.

Workday Adaptive Planning Tips: Override Formulas in Sheets
Workday Adaptive Planning Tricks: Override formulas in sheets

The team at Revelwood has been recognized by Workday Adaptive Planning for our thought leadership in the space, commitment to our Workday Adaptive Planning practice, and our rapid achievements of milestones. Visit Revelwood’s Knowledge Center for our Workday Adaptive Planning Tips & Tricks or sign up here to get our Workday Adaptive Planning Tips & Tricks delivered directly to your inbox. Not sure where to start with Workday Adaptive Planning? Our team here at Revelwood can help! Contact us info@revelwood.com for more information.

Read more Workday Adaptive Planning Tips & Tricks:

Workday Adaptive Planning Tips & Tricks: Templates

Workday Adaptive Planning Tips & Tricks: Trigger for a Cube Calculated Account

Workday Adaptive Planning Tips & Tricks: Alternate Time Tree

Home » Budgeting Planning & Forecasting » Page 9

Filed Under: Workday Adaptive Planning Tips & Tricks Tagged With: Adaptive Insights, adaptive insights tips & tricks, Budgeting, Budgeting Planning & Forecasting, enterprise performance management, Financial Performance Management, Planning & Forecasting, Planning & Reporting, Workday Adaptive Planning, Workday Adaptive Planning Tips & Tricks

IBM Planning Analytics Tips & Tricks: Minimizing the Subset Area

November 3, 2020 by Lee Lazarow Leave a Comment

Tips & Tricks

Are your member names long and hard to see in the subset editor in IBM Planning Analytics? Does it get confusing to see both the available members and the current set at the same time? Both situations can be solved by hiding one side of the subset editor.

Here is an example of the subset editor which shows both the available members and the current set.

IBM Planning Analytics Tips & Tricks: Minimizing the Subset Area

Each of the two sections has an option to minimize the area. This is done by clicking on the minus symbol at the top of the applicable section.

IBM Planning Analytics: Minimizing the Subset Area

Once clicked, the applicable area will compress and the other area will expand. Note that you can only minimize one side at a time. Below are examples of what each screen will look like when compressed.

Minimized Available Members:

IBM Planning Analytics Tips: Minimizing the Subsea Area

Minimized Current Set:

Minimizing the subset area in IBM Planning Analytics

This approach will allow you to further customize your subset editor screen to allow you to focus only on the area you want to see.

IBM Planning Analytics, which TM1 is the engine for, is full of new features and functionality. Not sure where to start? Our team here at Revelwood can help. Contact us for more information at info@revelwood.com. And stay tuned for more Planning Analytics Tips & Tricks weekly in our Knowledge Center and in upcoming newsletters!

Read more IBM Planning Analytics Tips & Tricks:

IBM Planning Analytics Tips & Tricks: Maintaining Subset-Drive Consolidations

IBM Planning Analytics Tips & Tricks: Sort Elements within a Subset

IBM Planning Analytics Tips & Tricks: Subset Control Dimension

Home » Budgeting Planning & Forecasting » Page 9

Filed Under: IBM Planning Analytics Tips & Tricks Tagged With: Analytics, Budgeting Planning & Forecasting, Financial Performance Management, IBM Cognos TM1, IBM Planning Analytics, lee lazarow, Planning & Forecasting, Planning & Reporting, Planning Analytics Tips & Tricks, Revelwood, TM1

  • « Go to Previous Page
  • Page 1
  • Interim pages omitted …
  • Page 7
  • Page 8
  • Page 9
  • Page 10
  • Page 11
  • Interim pages omitted …
  • Page 26
  • Go to Next Page »

Footer

Revelwood Overview

Revelwood helps finance organizations close, consolidate, plan, monitor and analyze business performance. As experts in solutions for the Office of Finance, we partner with best-in-breed software companies by applying best practices guidance and our pre-configured applications to help businesses achieve their full potential.

EXPERTISE

  • Workday Adaptive Planning
  • IBM Planning Analytics
  • BlackLine

ABOUT

  • Who We Are
  • What We Do
  • How We Help
  • How We Think
  • Privacy

CONNECT

World Headquarters

Florham Park, NJ | 201 984 3030

European Headquarters

London & Edinburgh | +44 (0)131 240 3866

Latin America Office

Miami, FL | 201 987 4198

Email
info@revelwood.com

Copyright © 2025 · Revelwood Inc. All rights reserved. Revelwood® and the Revelwood logo are registered marks of Revelwood Inc.