• Skip to main content
  • Skip to footer
Revelwood Logo

Revelwood

Your SUPER-powered WP Engine Site

  • Who We Are
    • About Us
      • Our Company
      • Our Team
      • Partners
    • Careers
      • Join Our Team
  • What We Do
    • Solutions
      • Workday Adaptive Planning
      • IBM Planning Analytics
      • BlackLine
    • Services
      • Implementation Services
      • Customer Care
        • Help Desk
        • System Administration as a Service
      • Training
        • Workday Adaptive Planning Training
        • IBM Planning Analytics / TM1 Training
    • Products
      • DataMaestro
      • LightSpeed
      • IBM Planning Analytics Utilities
  • How We Help
    • Use Cases
    • Client Success Stories
  • How We Think
    • Knowledge Center
    • Events
    • News
  • Contact Us

enterprise performance management

IBM Planning Analytics Tips & Tricks: PAW Gridlines

April 20, 2021 by Lee Lazarow Leave a Comment

Have you ever created a PowerPoint slide by using gridlines to position your pieces and wished that you can do the same in IBM Planning Analytics (PAW)? Now you can! 

PAW version 57 introduced many settings that allow you to further customize and position your widgets. One specific setting is found within the general area of the dashboard properties settings.

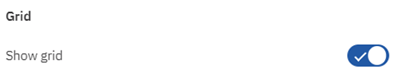
The Grid section contains a setting which allows you to enable or disable a grid on the page.

IBM Planning Analytics Tips & Tricks: PAW Gridlines

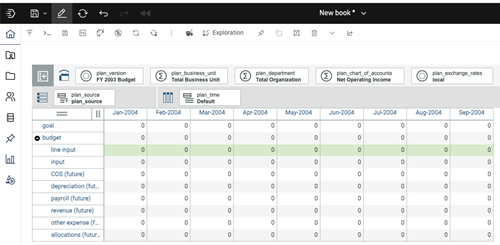
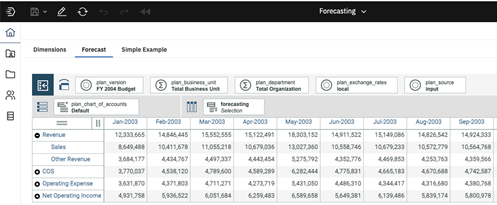
Here are examples of a dashboard with the grid turned on and with the grid turned off:

IBM Planning Analytics Tips & Tricks: PAW Gridlines

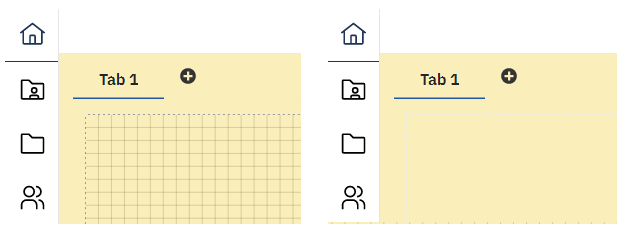
In addition, there are options which allow you enable or disable various “snap to” settings.

These new settings give you a more visual approach when creating your PAW books and help make your development easier.

IBM Planning Analytics, powered by TM1, is full of new features and functionality. Need advice? Our team here at Revelwood can help. Contact us for more information at info@revelwood.com. We post new Planning Analytics Tips & Tricks weekly in our Knowledge Center and in newsletters!

Read more IBM Planning Analytics Tips & Tricks

IBM Planning Analytics Tips & Tricks: Log Lock Notification

IBM Planning Analytics Tips & Tricks: Create New Books with the Diamond Icon

IBM Planning Analytics Tips & Tricks: The Waterfall Chart

Home » enterprise performance management » Page 5

Filed Under: IBM Planning Analytics Tips & Tricks Tagged With: enterprise performance management, Financial Performance Management, IBM Cognos TM1, IBM Planning Analytics, IBM Planning Analytics Workspace, Planning Analytics tips, Planning Analytics Tips & Tricks

IBM Planning Analytics Named Gartner Peer Insights Customer Choice for 2021

April 15, 2021 by Lisa Minneci Leave a Comment

News & Events

IBM Planning Analytics was named a Gartner Peer Insights Customer Choice for Cloud Financial Planning and Analysis. The solution received an overall peer rating of 4.6 on a scale of 5, with 68% of votes giving the product 5 stars. 92% of customers are willing to recommend IBM Planning Analytics.

The report, which you can view here, provides IBM Planning Analytics’ customers assessments on a number of product capabilities, customer experience, and service and support. IBM Planning Analytics earned scores between 4.3 and 4.7.

It also includes quotes from current customers relying on IBM Planning Analytics for planning, forecasting and report. For example:

Great Experience with the Cloud-Based Version of a Product I Knew Before as TM1

“This product is not only good in analyzing and displaying data, [but] also to collect ad-hoc data … I like the cloud version of this product; [it] makes global deployment extremely easy … The analytical part that this product offers should not be underestimated.”

Outstanding and Resourceful Financial Planning Application

“The determination of what [the] future holds relies on the planning part of the organization … IBM Planning Analytics is a product that fully focuses on the way financial activities get done … IBM Planning Analytics is a well-connected tool.”

A Planning and Analytics Solution that Enhances Efficiency

“IBM Planning Analytics is a great tool that helps us to make the best decisions for our business. The outcomes we get after making such kind of decisions are incredible. IBM Planning Analytics has superior features and is accurate to use.”

Read the full report on IBM Planning Analytics at Gartner Peer Insights.

Home » enterprise performance management » Page 5

Filed Under: News & Events Tagged With: cloud financial performance management, Cognos TM1, enterprise performance management, Financial Performance Management, Gartner Customer Choice, Gartner Peer Insights, Gartner report, IBM Cognos TM1, IBM Planning Analytics, TM1

IBM Planning Analytics Tips & Tricks: Database Administration

April 13, 2021 by Dillon Rossman Leave a Comment

Did you know that database administration page has been updated in IBM Planning Analytics Workspace (PAW)?  

In previous versions of PAW you would click on a database and it would present detailed information as seen below.

IBM Planning Analytics Tips & Tricks: Database Administration

With the “Database Settings” button you could update configuration settings and set performance thresholds and alerts.

IBM Planning Analytics Tips & Tricks: Database Administration

In PAW version 57 or later, this information can all be accessed from one page:

  • You can see various performance metrics on the “Details” tab
  • You can set thresholds and alerts on the “Alerts” tab
  • Thread information can be found on the “Threads” tab”
  • Configuration settings can be updated within the “Configuration” tab.

You are also able to easily switch between databases.

IBM Planning Analytics Tips & Tricks: Database Administration

The updated layout of the database administration page allows you to manage all your databases in a single page which contains everything you need.

IBM Planning Analytics, powered by TM1, is full of new features and functionality. Need advice? Our team here at Revelwood can help. Contact us for more information at info@revelwood.com. We post new Planning Analytics Tips & Tricks weekly in our Knowledge Center and in upcoming newsletters!

Read more IBM Planning Analytics Tips & Tricks:

IBM Planning Analytics Tips & Tricks: Administration Page Layout

IBM Planning Analytics Tips & Tricks: Subset Control Dimension

IBM Planning Analytics Tips & Tricks: PAW Pass Context

Home » enterprise performance management » Page 5

Filed Under: IBM Planning Analytics Tips & Tricks Tagged With: Cognos TM1, enterprise performance management, Financial Performance Management, IBM Cognos TM1, IBM Planning Analytics, IBM Planning Analytics database administration, IBM Planning Analytics Workspace, Planning Analytics tricks

IBM Planning Analytics Tips & Tricks: Converting Existing Applications

April 6, 2021 by Thanh Chau Leave a Comment

IBM Planning Analytics version 57 introduced applications and plans which let you organize Planning Analytics Workspace (PAW) assets such as books, view, and websheets into groups. These approaches allow you to group items together in sections (similar to a folder) or in steps (similar to a planning process). It is easy to create an Application or Plan in PAW, but there may be situations where you want to change the type by converting an existing Application to a Plan or vice versa.

To convert an existing Application or Plan, open the object so you can make edits. Then click on the Actions menu and select “Save as.”

IBM Planning Analytics Tips & Tricks: Converting Existing Applications

The window that appears will allow you to rename the object as well as select the type to save it as.

IBM Planning Analytics Tips & Tricks: Converting Existing Applications

This will create another copy of the object. Your original Application or Plan will remain as is.

This feature will allow you to change your PAW organization approach as your requirements and process approach changes.

IBM Planning Analytics, powered by TM1, is full of new features and functionality. Not sure where to start? Our team here at Revelwood can help. Contact us for more information at info@revelwood.com. And stay tuned for more Planning Analytics Tips & Tricks weekly in our Knowledge Center and in upcoming newsletters!

Read more IBM Planning Analytics Tips & Tricks:

IBM Planning Analytics Tips & Tricks: Introduction to Apps and Plans

IBM Planning Analytics Tips & Tricks: Creating Groups in PAW

IBM Planning Analytics Tips & Tricks: PAW Pass Context

Home » enterprise performance management » Page 5

Filed Under: IBM Planning Analytics Tips & Tricks Tagged With: enterprise performance management, Financial Performance Management, IBM Cognos TM1, IBM Planning Analytics, IBM Planning Analytics Workspace, Planning Analytics Apps, Planning Analytics Plans, TM1

IBM Planning Analytics Tips & Tricks: MS Word AutoCorrect

March 30, 2021 by Lee Lazarow Leave a Comment

Tips & Tricks

Part of implementing IBM Planning Analytics is ensuring that users understand their model. This often entails documentation that is created as a Microsoft Word document. Most of us know how to use Word but get frustrated typing some of the complex OLAP terms that are required to explain the model. Did you know that Word has a feature which allows you to solve this?

The AutoCorrect feature in Word allows you to define an abbreviation which is replace when you complete a word. This is defined by going into the Word options and selecting Proofing, AutoCorrect Options.

IBM Planning Analytics Tips & Tricks: MS Word Auto Correct

In addition to the list of predefined abbreviations that Microsoft has set up, I use this for the following list of words:

Abbreviation   Full Phrase

consol              consolidation

consols            consolidations

dim                  dimension

dims                dimensions

hier                  hierarchy

hiers                hierarchies

scen                 scenario

I also use this to quickly set up arrows and bullets:

—                      → (an arrow)

*                      •   (a bullet point)

This approach will help you create documents, both notes and formal manuals, faster and easier vs. having to stop and correct the complicated words that arise in our OLAP world.

IBM Planning Analytics, which TM1 is the engine for, is full of new features and functionality. Not sure where to start? Our team here at Revelwood can help. Contact us for more information at info@revelwood.com. And stay tuned for more Planning Analytics Tips & Tricks weekly in our Knowledge Center and in upcoming newsletters!

Learn more IBM Planning Analytics Tips & Tricks:

IBM Planning Analytics Tips & Tricks: Learn the Excel CELL Formula

IBM Planning Analytics Tips & Tricks: Manipulating Text in Excel

IBM Planning Analytics Tips & Tricks: Excel Keyboard Navigation

Home » enterprise performance management » Page 5

Filed Under: IBM Planning Analytics Tips & Tricks, Uncategorized Tagged With: enterprise performance management, Financial Performance Management, FP&A, IBM Cognos TM1, IBM Planning Analytics, MS word autocorrect, Planning Analytics tips, Planning Analytics Tips & Tricks, TM1

IBM Planning Analytics Tips & Tricks: Administration Page Layout

March 23, 2021 by Dillon Rossman Leave a Comment

Tips & Tricks

Did you know that the administration page layout has changed in IBM Planning Analytics Workspace (PAW) update 57?

In previous versions of PAW, the administration page used a tabbed approach that separated each component into its own tab. This required administrators to click through each tab to gain insight on a single component.

IBM Planning Analytics Tips & Tricks: Administration Page Layout

In PAW version 57 and later the administration page uses a tiled approach. Each tile represents the individual components of PAW administration. IBM has also incorporated some basic insights for several components. This provides a singular place where administrators can see a high-level status of PAW rather than having to click through each tab. If an administrator spots an issue or needs further information for a specific component then he/she can simply click into the tile.

IBM Planning Analytics Tips & Tricks: Administration Page Layout

IBM Planning Analytics, which TM1 is the engine for, is full of new features and functionality. Not sure where to start? Our team here at Revelwood can help. Contact us for more information at info@revelwood.com. And stay tuned for more Planning Analytics Tips & Tricks weekly in our Knowledge Center and in upcoming newsletters!

Read more IBM Planning Analytics Tips & Tricks:

IBM Planning Analytics Tips & Tricks: Home Button

IBM Planning Analytics Tips & Tricks: Merge an Icon and a Button, Part 1

IBM Planning Analytics Tips & Tricks: Merge an Icon and a Button, Part 2

Home » enterprise performance management » Page 5

Filed Under: IBM Planning Analytics Tips & Tricks Tagged With: enterprise performance management, Financial Performance Management, IBM Cognos TM1, IBM Planning Analytics, IBM Planning Analytics administration, IBM Planning Analytics Workspace, Planning Analytics tips, Planning Analytics Tips & Tricks, Planning Analytics Workspace, TM1, TM1 administration

IBM Planning Analytics Tips & Tricks: Introduction to Apps and Plans

March 16, 2021 by Thanh Chau Leave a Comment

As of version 58 of IBM Planning Analytics Workspace (PAW), IBM introduced new features called Applications and Plans. These are meant to guide business processes by centralizing and organizing required tasks to make sure that all steps are completed in the correct sequence.

To access the area, click on the Applications and Plans pane on the homepage when you first log onto PAW.

IBM Planning Analytics Workspace: Introduction to Apps and Plans

On the next page, you can create a new application or plan by clicking on the “Create” drop down and selecting the appropriate option.

IBM Planning Analytics Workspace: Introduction to Apps and Plans

Before you can add to your application or plan, you must enter a name.

IBM Planning Analytics Workspace: Introduction to Apps and Plans

For applications, you can add “sections” to your process. Each section corresponds to a step in your business process. You can add assets such as PAW views, websheets, or books for users to access easily. You can also assign PAW groups to each step to show who is responsible for completing that task.

IBM Planning Analytics Workspace: Introduction to Apps and Plans

Plans are similar to applications, but they also provide the ability to set due dates and allow for submissions as a form of approval or completion notice.

IBM Planning Analytics Workspace: Introduction to Apps and Plans

So when would you use each type?

  • Applications are designed to be used as a guide for set business processes that do not depend on multiple groups. Examples include CAR requests, monthly forecasting steps, cost center requests, or variance reviews.
  • Plans are for collaboration in which the steps are dependent upon each other or other groups. This is typically the annual budget process and special projects such as mergers and acquisitions which require steps to be completed in a timely manner.

IBM Planning Analytics, which TM1 is the engine for, is full of new features and functionality. Not sure where to start? Our team here at Revelwood can help. Contact us for more information at info@revelwood.com. And stay tuned for more Planning Analytics Tips & Tricks weekly in our Knowledge Center and in upcoming newsletters!

Read more IBM Planning Analytics Tips & Tricks:

IBM Planning Analytics Tips & Tricks: Creating Groups in PAW

IBM Planning Analytics Tips & Tricks: PAW Pass Context

IBM Planning Analytics Tips & Tricks: Home Button

Home » enterprise performance management » Page 5

Filed Under: IBM Planning Analytics Tips & Tricks Tagged With: Budgeting Planning & Forecasting, enterprise performance management, Financial Performance Management, IBM Cognos TM1, IBM Planning Analytics, IBM Planning Analytics Workspace, IBM Planning Analytics Workspace apps, IBM Planning Analytics Workspace plans, Revelwood, TM1

FP&A Done Right: Collaborate More When Planning

March 12, 2021 by Revelwood Leave a Comment

FP&A Done Right: Collaborate More When Planning

This is a guest blog post from our partner Workday Adaptive Planning, recommending how to get other departments to collaborate with the Office of Finance.  

When it comes to business, collaboration is vital. After all, no single department can do its job for long without the other departments pulling their own weight. Sales is no good if shipping can’t deliver; marketing falls flat if customer service keeps alienating users; everything grinds to a halt if human resources doesn’t provide the appropriate staffing.

But for some reason, when it comes to the numbers, it can feel like every department is on its own. Data is often stuck in silos, making it difficult or even impossible for other departments to get the information they need to do their jobs well.

Nowhere is this more evident than in the department that makes numbers its business: finance.

But achieving a collaborative finance function can be difficult. That’s because FP&A often lacks the necessary time, direction, or clarity around KPIs to build the cross-functional relationships required to improve forecasting and reporting. So what should be a team effort becomes a finance exercise, and when numbers change, it becomes finance’s fault. In the end, we lose credibility as a business partner.

Make Your Data Everyone’s Data

So how do you get other departments to collaborate with finance? Start by empowering your business partners with more ownership and accountability in the data and your process. For example, many businesses still do most of their forecasting and planning with spreadsheets. Not only is this wildly inefficient (not to mention more likely to include errors), but it keeps all the information bottled up on one person’s screen until they’re ready to share.

We all have seen an Excel spreadsheet named finalV2 or Final V3, only to find out our business partners are using FinalV6. This is a leading cause of number mismatch. Using modern finance tools, a finance team can collect and report on the numbers without needing to send and receive Excel spreadsheets. Everyone is on the same version and making the changes together. This just makes the business partners a part of the overall process, not part of the problem.

The more you can modernize your process and increase visibility into KPIs across the company, the more others will think of “our numbers” instead of “finance’s numbers.” When you create a single source of truth and share it, collaborators will be able to move past arguing about the numbers and start working together to decide on next steps.

A Strategic Bonus to Collaborative Finance

As a bonus, automation and dashboards for self-service collaborative reporting can vastly reduce the amount of transactional work the finance team has to accomplish each day. This frees up our time for both increased collaboration and providing the strategic, high-level analysis that helps move the company forward.

The bottom line: Financial collaboration becomes easier when you stop relying on static spreadsheets. It starts with getting the entire team working with one, trusted set of numbers, and building on a foundation of accurate, up to date data.

This blog post was originally published on the Workday Adaptive Planning blog and appeared here.

Check out more FP&A Done Right posts here:

FP&A Done Right: Five Tips for Budgeting in the Age of COVID

FP&A Done Right: To Recover from Economic Shock, Are CFOs Envisioning Enough Scenarios?

FP&A Done Right: Three Driver-based Budgeting Tips for CFOs when Change is Imminent

Home » enterprise performance management » Page 5

Filed Under: FP&A Done Right Tagged With: Adaptive Insights, Budgeting Planning & Forecasting, enterprise performance management, FP&A, FP&A done right, Planning & Forecasting, Planning & Reporting

IBM Planning Analytics Tips & Tricks: Planning Analytics Forecasting – Setting up the Forecast

March 9, 2021 by Nina Inverso Leave a Comment

This is part three in a three-part series on IBM Planning Analytics’ new feature, Forecasting. 

In our previous blog about IBM Planning Analytics’ new Forecasting feature, we reviewed the steps required to preview your forecast. Once previewed, you can then run your Forecast.

  1. Open a Planning Analytics Workspace (PAW) book and add a new cube view. Setting up the forecast in IBM Planning Analytics Forecasting
  2. Place the time dimension’s flat hierarchy alone on the columns. As of PAW version 2.0.60, you will no longer be required to display the entire hierarchy on the view. Instead, you will have the option to select the scope of the historical data used in the forecast.
  3. Select the context and row elements to forecast. For example:
    • Drag the account dimension on top of the source dimension to swap their positions.
    • Click on the version dimension to select a different version of the data from the drop-down list.
    • Double-click on the account dimension to select the row elements. Setting up the forecast in IBM Planning Analytics Forecasting

Your PAW cube view is now ready as a Planning Analytics Forecasting model.

IBM Planning Analytics, which TM1 is the engine for, is full of new features and functionality. Not sure where to start? Our team here at Revelwood can help. Contact us for more information at info@revelwood.com. And stay tuned for more Planning Analytics Tips & Tricks weekly in our Knowledge Center and in upcoming newsletters!

Read more IBM Planning Analytics Tips & Tricks:

IBM Planning Analytics Tips & Tricks: Planning Analytics Forecasting – Configuring the Time Dimension

IBM Planning Analytics Tips & Tricks: Planning Analytics Forecasting – Configuring the Forecast Settings

IBM Planning Analytics Tips & Tricks: Planning Analytics Forecasting – Previewing the Forecast

Home » enterprise performance management » Page 5

Filed Under: IBM Planning Analytics Tips & Tricks Tagged With: Budgeting Planning & Forecasting, enterprise performance management, Financial Performance Management, IBM Cognos TM1, IBM Planning Analytics, IBM Planning Analytics Forecasting, Planning & Forecasting, Planning Analytics tips, Planning Analytics Tips & Tricks, Revelwood, setting up forecast + Planning Analytics, TM1

  • « Go to Previous Page
  • Page 1
  • Interim pages omitted …
  • Page 3
  • Page 4
  • Page 5
  • Page 6
  • Page 7
  • Page 8
  • Go to Next Page »

Footer

Revelwood Overview

Revelwood helps finance organizations close, consolidate, plan, monitor and analyze business performance. As experts in solutions for the Office of Finance, we partner with best-in-breed software companies by applying best practices guidance and our pre-configured applications to help businesses achieve their full potential.

EXPERTISE

  • Workday Adaptive Planning
  • IBM Planning Analytics
  • BlackLine

ABOUT

  • Who We Are
  • What We Do
  • How We Help
  • How We Think
  • Privacy

CONNECT

World Headquarters

Florham Park, NJ | 201 984 3030

European Headquarters

London & Edinburgh | +44 (0)131 240 3866

Latin America Office

Miami, FL | 201 987 4198

Email
info@revelwood.com

Copyright © 2025 · Revelwood Inc. All rights reserved. Revelwood® and the Revelwood logo are registered marks of Revelwood Inc.