• Skip to main content
  • Skip to footer
Revelwood Logo

Revelwood

Your SUPER-powered WP Engine Site

  • Who We Are
    • About Us
      • Our Company
      • Our Team
      • Partners
    • Careers
      • Join Our Team
  • What We Do
    • Solutions
      • Workday Adaptive Planning
      • IBM Planning Analytics
      • BlackLine
    • Services
      • Implementation Services
      • Customer Care
        • Help Desk
        • System Administration as a Service
      • Training
        • Workday Adaptive Planning Training
        • IBM Planning Analytics / TM1 Training
    • Products
      • DataMaestro
      • LightSpeed
      • IBM Planning Analytics Utilities
  • How We Help
    • Use Cases
    • Client Success Stories
  • How We Think
    • Knowledge Center
    • Events
    • News
  • Contact Us

Planning Analytics tips

IBM Planning Analytics Tips & Tricks: Shortcuts in PAW Models

August 16, 2022 by Revelwood

Did you know there are shortcuts you can use in IBM Planning Analytics Workspace (PAW) when creating new models?

In legacy tools such as Architect, required that you create your dimensions, cubes, processes and chores one piece at a time. IBM Planning Analytics now provides shortcuts to streamline this process.

Watch our latest IBM Planning Analytics Tips & Tricks video to see Lee Lazarow, FP&A Technology Director, demonstrates how to use the section “modeling tools” to create your dimensions, cubes, processes and chores more quickly and easily.

In the past you would need to create each component piece by piece, navigating back and forth between the components. Now you can create a cube – and all its components – in nearly no time!

Check back next month for a new IBM Planning Analytics Tips & Tricks video!

Revelwood has worked with IBM Planning Analytics / TM1 for more than 27 years. We’ve partnered with hundreds of companies on the design, development, maintenance and updates of IBM Planning Analytics applications, across every industry. Have a challenge with Planning Analytics / TM1? We can help you!

See more IBM Planning Analytics Tips & Tricks videos:

IBM Planning Analytics Tips & Tricks: Displaying Percentages on a Planning Analytics (PAW) Pie Chart

IBM Planning Analytics Tips & Tricks: Color Schemes in a Waterfall Chart

IBM Planning Analytics Tips & Tricks: Defining a Process Within Existing Chores

Home » Planning Analytics tips

Filed Under: IBM Planning Analytics Tips & Tricks Tagged With: Financial Performance Management, IBM Planning Analytics, PAW models, PAW shortcuts, Planning Analytics models, Planning Analytics shortcuts, Planning Analytics tips, TM1, TM1 Tips, TM1 Tips & Tricks, TM1 Tricks

IBM Planning Analytics Tips & Tricks: PAW Gridlines

April 20, 2021 by Lee Lazarow Leave a Comment

Have you ever created a PowerPoint slide by using gridlines to position your pieces and wished that you can do the same in IBM Planning Analytics (PAW)? Now you can! 

PAW version 57 introduced many settings that allow you to further customize and position your widgets. One specific setting is found within the general area of the dashboard properties settings.

The Grid section contains a setting which allows you to enable or disable a grid on the page.

IBM Planning Analytics Tips & Tricks: PAW Gridlines

Here are examples of a dashboard with the grid turned on and with the grid turned off:

IBM Planning Analytics Tips & Tricks: PAW Gridlines

In addition, there are options which allow you enable or disable various “snap to” settings.

These new settings give you a more visual approach when creating your PAW books and help make your development easier.

IBM Planning Analytics, powered by TM1, is full of new features and functionality. Need advice? Our team here at Revelwood can help. Contact us for more information at info@revelwood.com. We post new Planning Analytics Tips & Tricks weekly in our Knowledge Center and in newsletters!

Read more IBM Planning Analytics Tips & Tricks

IBM Planning Analytics Tips & Tricks: Log Lock Notification

IBM Planning Analytics Tips & Tricks: Create New Books with the Diamond Icon

IBM Planning Analytics Tips & Tricks: The Waterfall Chart

Home » Planning Analytics tips

Filed Under: IBM Planning Analytics Tips & Tricks Tagged With: enterprise performance management, Financial Performance Management, IBM Cognos TM1, IBM Planning Analytics, IBM Planning Analytics Workspace, Planning Analytics tips, Planning Analytics Tips & Tricks

IBM Planning Analytics Tips & Tricks: MS Word AutoCorrect

March 30, 2021 by Lee Lazarow Leave a Comment

Tips & Tricks

Part of implementing IBM Planning Analytics is ensuring that users understand their model. This often entails documentation that is created as a Microsoft Word document. Most of us know how to use Word but get frustrated typing some of the complex OLAP terms that are required to explain the model. Did you know that Word has a feature which allows you to solve this?

The AutoCorrect feature in Word allows you to define an abbreviation which is replace when you complete a word. This is defined by going into the Word options and selecting Proofing, AutoCorrect Options.

IBM Planning Analytics Tips & Tricks: MS Word Auto Correct

In addition to the list of predefined abbreviations that Microsoft has set up, I use this for the following list of words:

Abbreviation   Full Phrase

consol              consolidation

consols            consolidations

dim                  dimension

dims                dimensions

hier                  hierarchy

hiers                hierarchies

scen                 scenario

I also use this to quickly set up arrows and bullets:

—                      → (an arrow)

*                      •   (a bullet point)

This approach will help you create documents, both notes and formal manuals, faster and easier vs. having to stop and correct the complicated words that arise in our OLAP world.

IBM Planning Analytics, which TM1 is the engine for, is full of new features and functionality. Not sure where to start? Our team here at Revelwood can help. Contact us for more information at info@revelwood.com. And stay tuned for more Planning Analytics Tips & Tricks weekly in our Knowledge Center and in upcoming newsletters!

Learn more IBM Planning Analytics Tips & Tricks:

IBM Planning Analytics Tips & Tricks: Learn the Excel CELL Formula

IBM Planning Analytics Tips & Tricks: Manipulating Text in Excel

IBM Planning Analytics Tips & Tricks: Excel Keyboard Navigation

Home » Planning Analytics tips

Filed Under: IBM Planning Analytics Tips & Tricks, Uncategorized Tagged With: enterprise performance management, Financial Performance Management, FP&A, IBM Cognos TM1, IBM Planning Analytics, MS word autocorrect, Planning Analytics tips, Planning Analytics Tips & Tricks, TM1

IBM Planning Analytics Tips & Tricks: Administration Page Layout

March 23, 2021 by Dillon Rossman Leave a Comment

Tips & Tricks

Did you know that the administration page layout has changed in IBM Planning Analytics Workspace (PAW) update 57?

In previous versions of PAW, the administration page used a tabbed approach that separated each component into its own tab. This required administrators to click through each tab to gain insight on a single component.

IBM Planning Analytics Tips & Tricks: Administration Page Layout

In PAW version 57 and later the administration page uses a tiled approach. Each tile represents the individual components of PAW administration. IBM has also incorporated some basic insights for several components. This provides a singular place where administrators can see a high-level status of PAW rather than having to click through each tab. If an administrator spots an issue or needs further information for a specific component then he/she can simply click into the tile.

IBM Planning Analytics Tips & Tricks: Administration Page Layout

IBM Planning Analytics, which TM1 is the engine for, is full of new features and functionality. Not sure where to start? Our team here at Revelwood can help. Contact us for more information at info@revelwood.com. And stay tuned for more Planning Analytics Tips & Tricks weekly in our Knowledge Center and in upcoming newsletters!

Read more IBM Planning Analytics Tips & Tricks:

IBM Planning Analytics Tips & Tricks: Home Button

IBM Planning Analytics Tips & Tricks: Merge an Icon and a Button, Part 1

IBM Planning Analytics Tips & Tricks: Merge an Icon and a Button, Part 2

Home » Planning Analytics tips

Filed Under: IBM Planning Analytics Tips & Tricks Tagged With: enterprise performance management, Financial Performance Management, IBM Cognos TM1, IBM Planning Analytics, IBM Planning Analytics administration, IBM Planning Analytics Workspace, Planning Analytics tips, Planning Analytics Tips & Tricks, Planning Analytics Workspace, TM1, TM1 administration

IBM Planning Analytics Tips & Tricks: Planning Analytics Forecasting – Setting up the Forecast

March 9, 2021 by Nina Inverso Leave a Comment

This is part three in a three-part series on IBM Planning Analytics’ new feature, Forecasting. 

In our previous blog about IBM Planning Analytics’ new Forecasting feature, we reviewed the steps required to preview your forecast. Once previewed, you can then run your Forecast.

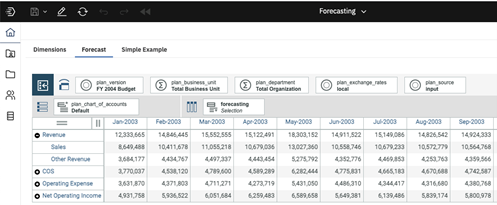
  1. Open a Planning Analytics Workspace (PAW) book and add a new cube view. Setting up the forecast in IBM Planning Analytics Forecasting
  2. Place the time dimension’s flat hierarchy alone on the columns. As of PAW version 2.0.60, you will no longer be required to display the entire hierarchy on the view. Instead, you will have the option to select the scope of the historical data used in the forecast.
  3. Select the context and row elements to forecast. For example:
    • Drag the account dimension on top of the source dimension to swap their positions.
    • Click on the version dimension to select a different version of the data from the drop-down list.
    • Double-click on the account dimension to select the row elements. Setting up the forecast in IBM Planning Analytics Forecasting

Your PAW cube view is now ready as a Planning Analytics Forecasting model.

IBM Planning Analytics, which TM1 is the engine for, is full of new features and functionality. Not sure where to start? Our team here at Revelwood can help. Contact us for more information at info@revelwood.com. And stay tuned for more Planning Analytics Tips & Tricks weekly in our Knowledge Center and in upcoming newsletters!

Read more IBM Planning Analytics Tips & Tricks:

IBM Planning Analytics Tips & Tricks: Planning Analytics Forecasting – Configuring the Time Dimension

IBM Planning Analytics Tips & Tricks: Planning Analytics Forecasting – Configuring the Forecast Settings

IBM Planning Analytics Tips & Tricks: Planning Analytics Forecasting – Previewing the Forecast

Home » Planning Analytics tips

Filed Under: IBM Planning Analytics Tips & Tricks Tagged With: Budgeting Planning & Forecasting, enterprise performance management, Financial Performance Management, IBM Cognos TM1, IBM Planning Analytics, IBM Planning Analytics Forecasting, Planning & Forecasting, Planning Analytics tips, Planning Analytics Tips & Tricks, Revelwood, setting up forecast + Planning Analytics, TM1

IBM Planning Analytics Tips & Tricks: Planning Analytics Forecasting – Previewing the Forecast

March 2, 2021 by Nina Inverso Leave a Comment

This is part two of a three-part series on IBM Planning Analytics new Forecasting feature. 

In our first blog about Planning Analytics’ new Forecasting feature, we reviewed the steps required to configure your forecast. Once configured, you can then preview your forecast before to get a better idea of the results prior to populating the cube.

  1. Open the PAW book that contains your forecast view. Previewing the forecast in IBM Planning Analytics
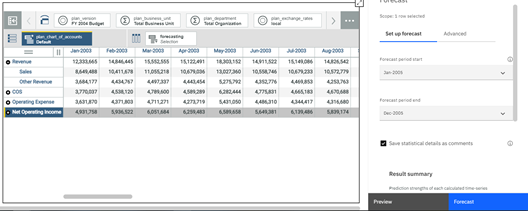
  2. Click anywhere on the view to activate it. Then click the Forecast icon in the ribbon at the top of the screen. This will open the Forecast window on the right-hand side of your screen. Configure the forecast settings if you have not already done so. Previewing the forecast in IBM Planning Analytics
  3. Click on one of the elements in your row dimension to select the row. Then click the Preview button in the Forecast window on the right-hand side of your screen. Previewing the forecast in IBM Planning Analytics
  4. The Forecast preview window will open. There are two tabs with information about the forecast:

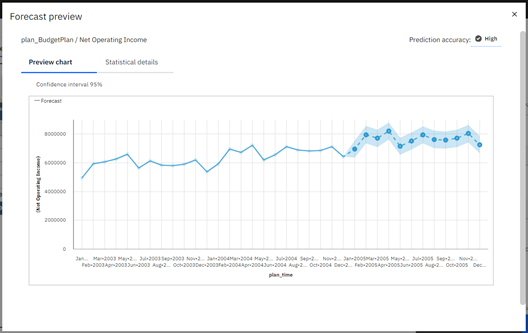
a. Preview chart

Previewing the forecast in IBM Planning Analytics

The Preview chart depicts displays the forecasted data, along with a surrounding shaded area. There is a 95% chance that the actual values will fall in this shaded area (or cloud).

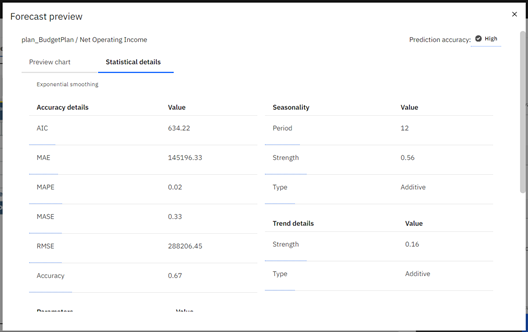
b. Statistical details

Previewing the forecast in IBM Planning Analytics

The Statistical details tab provides key information used by the model to forecast your data. Read more about these values here.

In our next blog post, we will review how to run your Planning Analytics Forecasting model.

IBM Planning Analytics, which TM1 is the engine for, is full of new features and functionality. Not sure where to start? Our team here at Revelwood can help. Contact us for more information at info@revelwood.com. And stay tuned for more Planning Analytics Tips & Tricks weekly in our Knowledge Center and in upcoming newsletters!

Read more IBM Planning Analytics Tips & Tricks:

IBM Planning Analytics Tips & Tricks: Configuring the Time Dimension

IBM Planning Analytics Tips & Tricks: Configuring the Forecast Settings

IBM Planning Analytics Tips & Tricks: Convert Existing View Directly to Reports

Home » Planning Analytics tips

Filed Under: IBM Planning Analytics Tips & Tricks Tagged With: Budgeting Planning & Forecasting, enterprise performance management, Financial Performance Management, IBM Cognos TM1, IBM Planning Analytics, IBM Planning Analytics Forecasting, Planning & Forecasting, Planning Analytics tips, Planning Analytics Tips & Tricks, TM1

IBM Planning Analytics Tips & Tricks: Dimension Attribute Types

February 9, 2021 by Marc Assenza Leave a Comment

Tips & Tricks

Did you know that IBM Planning Analytics dimensions can have defined types and that these defined types are necessary for certain Planning Analytics features to operate correctly? For example, the new predictive forecasting functionality within Planning Analytics Workspace (PAW) requires the use of a designated Time dimension.

To view your dimension definitions in Planning Analytics Workspace, right-click on Dimensions and click “Edit settings” from the context menu.

IBM Planning Analytics Tips: Dimension Attribute Types

The dimensions view will open in Dimensions Security Mode. To see the dimension types, switch to Dimensions Attributes Mode.

IBM Planning Analytics Tricks: Dimension Attribute Types

Attributes for each dimension are then presented. Not every dimension needs to have a defined dimension type, but some dimensions need to be defined to use specific functionality. The following types can be defined:

  • GEOGRAPHY – Used in Planning Analytics Workspace to allow the visualization of your data using geographic maps.
  • TIME – Contains specified and recognized intervals of time utilized within a budgeting, planning, forecasting, and reporting structure.
  • CALCULATION – Contains formulas used to perform intended operations against your data.
  • METRIC – Contains a group or groups of elements that will be used to measure a business’s Key Performance Indicators (KPI’s).
  • METRIC INDICATORS – Provides further information in relation to Key Performance Indicators (KPI’s), an example of this is trend.
  • VERSIONS – Contains data from multiple uses of an element, such as current budget for a department for this year compared against the department’s budgets for prior years.
  • GENERIC – Used when there is no precise type of dimension type required. These general members can include things like products and customers. Please note this can be changed at any point if you determine the dimension should have had or needs to be a defined type.
  • HIERARCHY – This type of dimension is representative of the business reporting structure and can be used in tandem with workflow within an application.

This approach can be used with functionality associated with visualizations, predictive modeling, and other uses of Planning Analytics.

IBM Planning Analytics, which TM1 is the engine for, is full of new features and functionality. Not sure where to start? Our team here at Revelwood can help. Contact us for more information at info@revelwood.com. And stay tuned for more Planning Analytics Tips & Tricks weekly in our Knowledge Center and in upcoming newsletters!

Read more IBM Planning Analytics Tips & Tricks:

IBM Planning Analytics Tips & Tricks: PA Modeling – The Dimension Editor

IBM Planning Analytics Tips & Tricks: Simplifying Dimension Maintenance

IBM Planning Analytics Tips & Tricks: Subset Control Dimension

Home » Planning Analytics tips

Filed Under: IBM Planning Analytics Tips & Tricks Tagged With: Budgeting Planning & Forecasting, enterprise performance management, Financial Performance Management, IBM Cognos TM1, IBM Planning Analytics, Planning & Forecasting, Planning & Reporting, Planning Analytics tips, Planning Analytics Tips & Tricks, TM1

IBM Planning Analytics Tips & Tricks: Manipulating Text in Excel

February 2, 2021 by Lee Lazarow Leave a Comment

Have you ever wanted to manipulate text within Excel? Excel has a series of functions that allow you to parse text strings based on whether you want to reference the left, the right, or the middle of the cell contents.

For example, assume cell A2 contains the text “Planning Analytics”. The functions LEFT and RIGHT will allow you to view characters at the start of the string or at the end of the string.

=LEFT(A2,3) will give a result of “Pla”

=RIGHT(A2,3) will give a result of “ics”

The function MID will allow you to look within the string by defining both a starting point and the number of characters in the result.

=MID(A2,3,3) will give a result of “ann”

But what if you didn’t know the number of characters? You can use functions to find a specific set of characters and to determine the overall length of the string.

=FIND(“A”,A2)-1 will give a result of “9”, which signifies that the string begins at the 9th character

=LEN(A2) will give a result of “18”, which signifies that the string contains 18 total characters

You can then put these pieces together to find a specific set of data, such as the second word in the string. Assuming that D6 contains the LEN function and D5 contains the FIND function:

=RIGHT(A2,D6-D5) will give a result of “Analytics”

These Excel functions will allow you to quickly parse out pieces of a text string which can then be used in your spreadsheets.

IBM Planning Analytics, which TM1 is the engine for, is full of new features and functionality. Not sure where to start? Our team here at Revelwood can help. Contact us for more information at info@revelwood.com. And stay tuned for more Planning Analytics Tips & Tricks weekly in our Knowledge Center and in upcoming newsletters!

Read more Excel tips in our IBM Planning Analytics Tips & Tricks series:

IBM Planning Analytics Tips & Tricks: Excel’s NETWORKDAYS Function

IBM Planning Analytics Tips & Tricks: Excel Keyboard Navigation

IBM Planning Analytics Tips & Tricks: Excel TYPE Function

Home » Planning Analytics tips

Filed Under: IBM Planning Analytics Tips & Tricks Tagged With: enterprise performance management, Excel, excel tips, Excel tips & tricks, excel tricks, Financial Performance Management, IBM Cognos TM1, IBM Planning Analytics, Planning Analytics tips, Planning Analytics Tips & Tricks, TM1

IBM Planning Analytics Tips & Tricks: Excel’s NETWORKDAYS Function

January 26, 2021 by Lee Lazarow Leave a Comment

Have you ever wanted to define the number of working days between two calendar dates? Do you define “working days” simply as non-weekend days or do you also include holidays? Did you know that you can calculate this information using Excel’s NETWORKDAYS function?

The NETWORKDAYS function is used to determine the number of whole working days between start_date and end_date. Working days are defined as the exclusion of weekends, which in essence computes the number of Mondays through Fridays. The function also includes an optional parameter to exclude holidays and any other specific non-working days.

The syntax of the function is:

NETWORKDAYS (start_date, end_date, [holidays])
  • Start_date: This is required
  • End_date: This is required
  • Holidays: This is optional
    • This consists of a range of one or more dates to be excluded from the calendar. The list entails a range of cells that contains the dates.

Note: All dates are entered in date format or in serial number format

This information can be used to help calculate any/all of the following pieces of your model:

  • Benefit accruals and eligibility
  • Ratios such as “Revenue per day” or “Units per day”
  • Days remaining for end-of-service dates
  • Anything else that requires the number of days within the formula

IBM Planning Analytics, which TM1 is the engine for, is full of new features and functionality. Not sure where to start? Our team here at Revelwood can help. Contact us for more information at info@revelwood.com. And stay tuned for more Planning Analytics Tips & Tricks weekly in our Knowledge Center and in upcoming newsletters!

Read more Excel tips in our IBM Planning Analytics Tips & Tricks series:

IBM Planning Analytics Tips & Tricks: Learn the Excel CELL Formula

IBM Planning Analytics Tips & Tricks: Excel TYPE Function

IBM Planning Analytics Tips & Tricks: Excel Keyboard Navigation

Home » Planning Analytics tips

Filed Under: IBM Planning Analytics Tips & Tricks Tagged With: enterprise performance management, Excel, Excel NETWORKDAYS, excel tips, Excel tips & tricks, excel tricks, Financial Performance Management, IBM Cognos TM1, IBM Planning Analytics, lee lazarow, Planning & Forecasting, Planning & Reporting, Planning Analytics tips, Planning Analytics Tips & Tricks, TM1

  • Page 1
  • Page 2
  • Page 3
  • Go to Next Page »

Footer

Revelwood Overview

Revelwood helps finance organizations close, consolidate, plan, monitor and analyze business performance. As experts in solutions for the Office of Finance, we partner with best-in-breed software companies by applying best practices guidance and our pre-configured applications to help businesses achieve their full potential.

EXPERTISE

  • Workday Adaptive Planning
  • IBM Planning Analytics
  • BlackLine

ABOUT

  • Who We Are
  • What We Do
  • How We Help
  • How We Think
  • Privacy

CONNECT

World Headquarters

Florham Park, NJ | 201 984 3030

European Headquarters

London & Edinburgh | +44 (0)131 240 3866

Latin America Office

Miami, FL | 201 987 4198

Email
info@revelwood.com

Copyright © 2025 · Revelwood Inc. All rights reserved. Revelwood® and the Revelwood logo are registered marks of Revelwood Inc.