This is a guest post from our partner BlackLine, explaining how to streamline and optimize the month-end close procedss.
What Is the Month-End Close Process?
The month-end close process is the series of activities accounting teams must monitor, perform, and review, on a monthly basis, to produce timely, accurate, and complete financial statements and related reporting. While the most important closing period comes at the end of the financial year, most businesses use month-end procedures to accurately track performance—a monthly closing process as part of regular accounting ensures that the numbers are reliable, stable, and accurate.
Why Is Optimizing the Month-End Close Important?
Extra time spent on the month-end close means less time spent on adding value through analysis and business partnering. Optimizing the month-end close will get financial numbers into the hands of leadership sooner to assist with timely analyses and smarter decision-making. Other reasons to optimize include better discipline, more structure, improved controls, more visibility, and reduced risk.
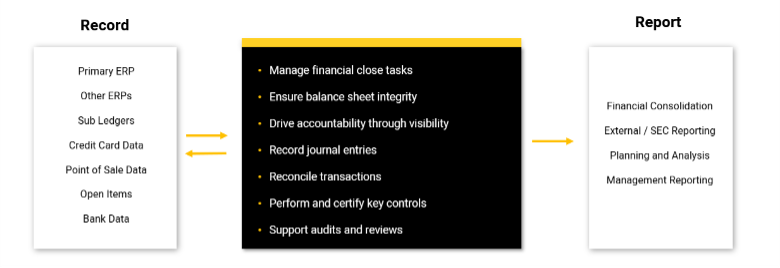
Flowchart for Month-End Close Process
Here is a month-end close process flowchart to visualize some of the key steps and processes.
What Are Month-End Procedures?
While traditionally a lot of the heavy lifting is done during a few peak days, the month-end close process is ongoing throughout the month as transactions are recorded in various systems.
Before reporting, accounting must capture, review, and make adjustments to data from disparate sources, which often include a primary ERP, other ERPs, sub-ledgers, banks, point-of-sale systems, and many others. When results are solidified and reviewed, accounting then reports results to stakeholders including internal management, external shareholders, regulatory bodies, and others.
When accountants think about the month-end close, they’re likely referring to the activities in the middle of the figure above, like substantiating balance sheet accounts, reconciling transactions, recording recurring journal entries, analyzing variances, monitoring critical tasks and controls, and supporting audits. These are the processes that require the most effort. These activities are traditionally performed manually in spreadsheets and stored in difficult to access emails or on shared drives.
How Long Does a Month-End Close Take?
Each company is different, so it’s impossible to say how long your month-end close should take. Surveys and research over the years show the month-end process generally takes between 5-10 days.
However, over the past decade, with help from technology, the close has been getting faster. According to Ventana Research in 2019, “63% of participants indicated their organization completes its monthly close within six business days, up from 53% in 2014, with nearly half (46%) now closing within four business days (the previous rate was 29%).”
Accounting teams face a lot of pressure to close the books fast because executives use the previous month’s financials to make business decisions for the upcoming months and quarters. Ventana Research notes, “Closing faster has value: 62% of those that close within six days say that the information they provide is timely, while only 39% of those that take longer say that.”
However, closing faster can mean a tradeoff between speed and accuracy. For example, using estimates rather than actuals can shave hours or days off your close, but that means your numbers may not be exact, and when it’s time to close the fiscal year, the actuals will still need to be determined. This may end up adding days to your year-end close.
What Are the Steps in the Closing Process?
Again, because all companies are different, there is no perfect month-end close checklist. For example, businesses that sell physical products will have the extra steps of tracking inventory while companies that are service-focused will not. Smaller companies may have fewer accounts while multinationals will have hundreds or thousands. But there are some key items most accounting teams will need and steps they’ll need to follow.
Some of the information accounting teams need to have on hand in order to close the monthly books:
- Total revenue numbers
- Bank account information
- Inventory levels (if applicable)
- Petty cash total
- Financial statements
- Balance sheets
- Total fixed assets
- Income and expense accounts
- General ledger
Common steps in closing the month-end books:
- Record all incoming cash and accounts receivable
- Review expenses and accounts payable records
- Reconcile accounts
- Review fixed assets
- Inventory count (if necessary)
- Collect and review financial documents
- Prepare financial statements
- Review all information for accuracy
Best Practices for a Month-End Close Process
When thinking about best practices for the month-end close, you may want to ask yourself these three questions about your month-end close process:
1. Do I have sufficient visibility into the entire month-end close process?
2. Have we done all we can to mitigate risk?
3. Am I paying highly trained professionals to perform remedial tasks?
If you identify challenges based on those questions, you may want to implement some of these month-end close best practices.
Conduct Pre- and Post-close Team Meetings
During pre-close meetings, the team should discuss follow-up items from the previous month’s post-close meeting and determine the current month’s close schedule and timeline. This way everyone is clear on responsibilities and deadlines. You should also determine what staff should do if they run into barriers and how they should communicate any bottlenecks.
In post-close meetings, discuss what worked and what didn’t, and review assigned roles and responsibilities for the next month. Review any lessons learned, any variances or abnormalities, and entertain any proposed changes to the process.
Manage your Time, be Organized, and Communicate Efficiently
Understanding deadlines and schedules is critical so you can work toward an ideal close date. Being organized will help you stay on track. In addition, accountants must begin to cultivate strong written communication skills with the ability to think critically. They will also need strong oral communication skill and the ability to convey pertinent financial information to executive teams and stakeholders.
Build Relationships
Exceptional accountants know how to manage numbers and people. That requires cultivating a broader range of relationship skills today, such as how to work in a team and how to engage with other departments. If other departments are aware of what you are doing and what you’ll need for each month-end in advance, they may be more willing to contribute the financial data you need on time.
Take Advantage of Automation
Refocus your teams on analysis by replacing repetitive, spreadsheet-heavy work with leading-practice automation. Centralize data and close activities, automate journal entries and reconciliations, strengthen controls, and enhance visibility.
Common Challenges in a Month-End Close Process
Some challenges finance and accounting teams encounter when performing a manual close process include:
- Team members don’t know what needs to be done and/or what is already completed
- Inaccurate or incomplete data
- Lack of standardization
- Processes that are not clearly defined
- Discrepancies between numbers
- Delayed reconciliations due to errors, adjustments, and reclassifications
- Lack of real-time data that results in little or no visibility and transparency
These challenges during the month-end close are likely why nearly 70% of CAOs recognize a need to change. The month-end close process relies on many people, technology, processes, and other inputs. As a result, accounting organizations are challenged by inconsistent data and processes and a lack of standardization across the enterprise—all while depending on spreadsheets, emails, phone calls, and in-person meetings to bring it all together.
As business leaders look for accounting to provide more real time insights, and while regulatory environments are increasingly complex, it becomes even more difficult for accounting to do it all on time without compromising compliance or control. Traditional manual accounting processes are simply not sustainable.
Transitioning away from manual workflows will give you access to one of the most efficient tools you’ll ever use: accounting automation.
How Financial Close Automation Technology Improves the Closing Process
In order to optimize the month-end close process, companies should embrace technology and innovation that enables transformation. Integrated solutions that address more than one aspect of the close process, and in particular, cloud solutions, are helping companies make the move to modern accounting—bit by bit. Let’s take a closer look at how automation technology improves the financial close process.
While there’s no one size fits all approach, many successful accounting organizations begin their optimization journey with close management by unifying data and processes and driving better accountability through visibility. Technology can be used to capture all tasks and embed workflow and segregation of duties. Leading solutions also help centralize supporting documents and provide dashboards for reporting on status and KPI’s.
Optimizing balance sheet substantiation and high-volume reconciliation processes is a natural next step, as preparing, reviewing, and retaining account reconciliations is a common pain point for accounting, and valuable resources spend a disproportionate amount of time on repetitive tasks like ticking and tying.
Technology not only standardizes account reconciliations using templates but improves continuity by embedding policies and procedures, reduces risk by importing general ledger account balances and other data directly from source systems, and drives efficiency by automating matching activities and up to 80% of certifications.
Another way to optimize the financial close is by addressing the journal entry process. Many organizations record hundreds, if not thousands of journal entries each month. Technology not only centralizes the journal entry process with workflow and integration to related balance sheet reconciliations but automates the creation, posting, and certification of a significant portion of a company’s entries. Harmonizing the process and supporting documentation in the cloud not only saves time during the close but also reduces audit testing and preparation.
Finally, intercompany accounting and governance is another area ripe for transformation, as it poses numerous challenges for accounting with complex regulatory requirements and cross-functional dependencies involving legal, tax, and other stakeholders. Accounting can use technology to proactively govern their intercompany process from transaction initiation through netting and settlement. End-to-end intercompany solutions facilitate the process with defined workflows, embedded controls, and automation.
This blog post was originally published on the BlackLine blog.
Read more about Modern Accounting:
Modern Accounting: The Impact of Investing in Accounts Receivable
Modern Accounting: Driving Sustainability
Modern Accounting: Why Does Intercompany Accounting Crash Your Close?