Did you know that while you are doing dimension maintenance, you can quickly view an element’s parents or children in IBM Planning Analytics Workspace (PAW) via a single click? Here’s how you can do this:
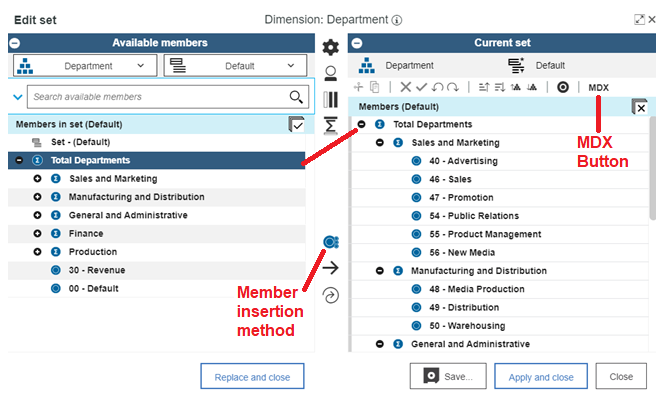
Step 1: Select the dimension to be edited. This is done by either right clicking on a dimension and selecting the option to “Edit Dimension” or by dragging the dimension onto a sheet.
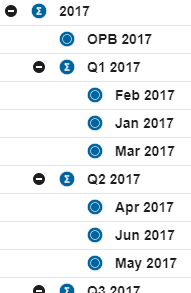
Step 2: Right click on an element and select the option to “Show Member.” You will then see two sub-options: one for Parents and one for Children.
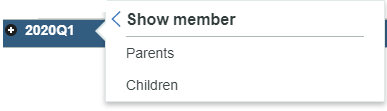
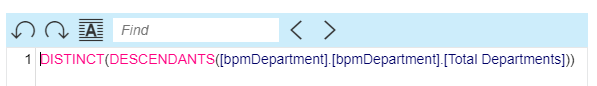
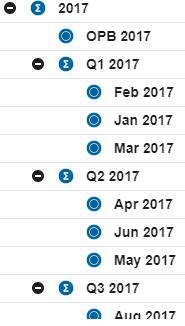
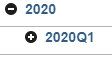
- If you select the option for Parents then you will see all of the parents associated with the selected element. In this example, there is only one parent within the dimension structure.
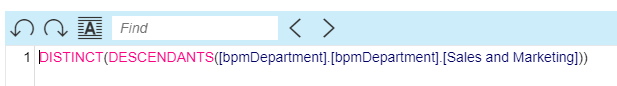
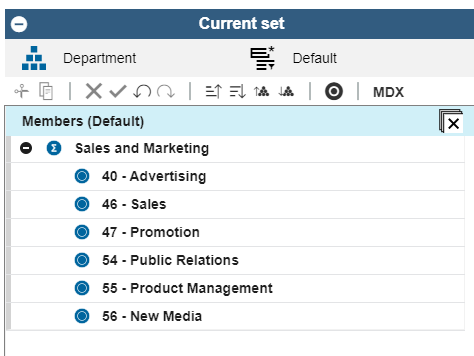
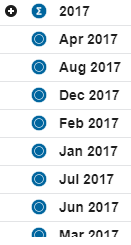
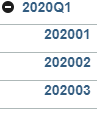
- If you select the option for Children then you will see all of the children associated with the selected element. In this example, there are three elements in the consolidation.
Once defined, you can then perform dimension maintenance to each of the elements on your screen.
This approach allows you to easily traverse up or down your dimension while minimizing the amount of extra elements on the screen.
IBM Planning Analytics, which TM1 is the engine for, is full of new features and functionality. Not sure where to start? Our team here at Revelwood can help. Contact us for more information at info@revelwood.com. And stay tuned for more Planning Analytics Tips & Tricks weekly in our Knowledge Center and in upcoming newsletters!
Read more IBM Planning Analytics Tips & Tricks:
IBM Planning Analytics Tips & Tricks: Sort Elements within a Subset
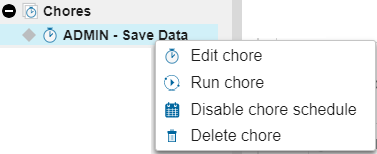
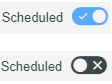
IBM Planning Analytics Tips & Tricks: Editing Chores While Active
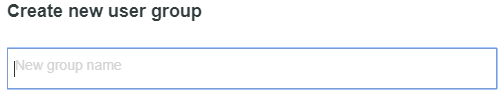
IBM Planning Analytics Tips & Tricks: Creating Groups in PAW