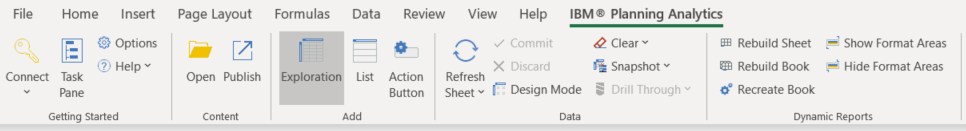
Did you know that Planning Analytics for Excel (PAx) provides the ability to convert an existing view directly to a report in Excel? Without opening the view as an Exploration, you can start building your report directly from the Task Pane.
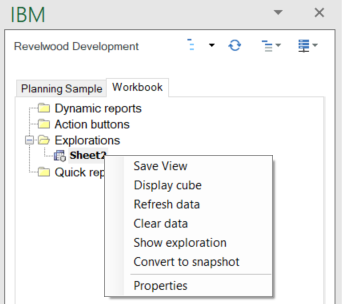
Just right-click on the view in the Task Pane to display the available options.
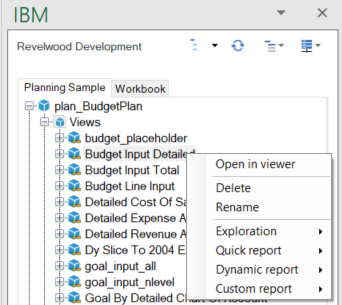
You will see the following options by hovering over the Quick report, Dynamic report, and Custom report items:
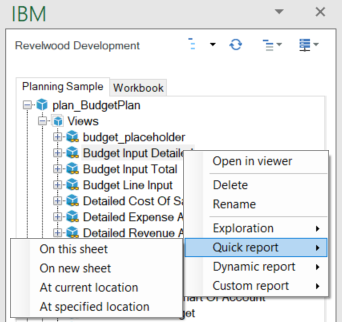
In this example, each of the items does the following:
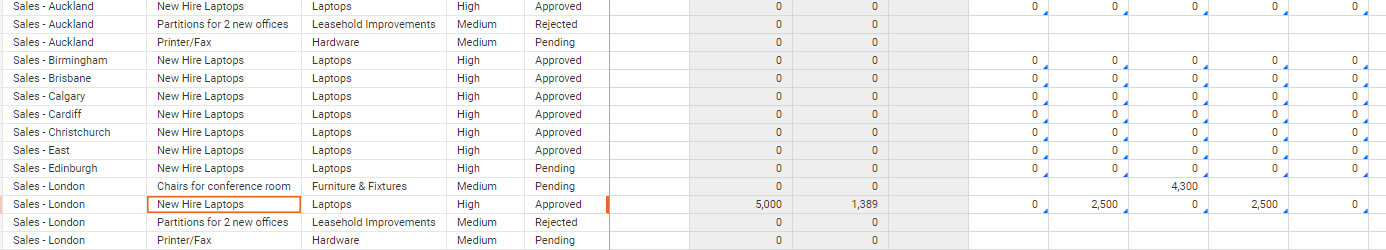
- On this sheet: This will open the existing Planning Analytics view as a Quick report on the current Excel sheet at cell $A$1.
- On new sheet: This will open the view as a Quick report on a new sheet at cell $A$1.
- At current location: This will open the view as a Quick report at the cell that is currently active.
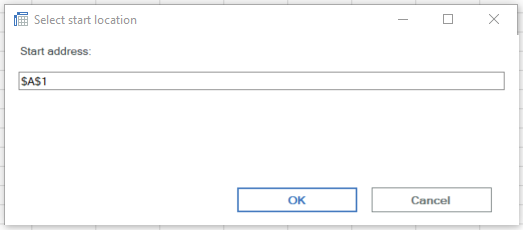
- At specified location: This will open a pop-up window that allows you to input the cell at which you would like the Quick report to appear. You can then enter the cell address and click OK to generate the Quick report, as shown in the following image.
IBM Planning Analytics, which TM1 is the engine for, is full of new features and functionality. Not sure where to start? Our team here at Revelwood can help. Contact us for more information at info@revelwood.com. And stay tuned for more Planning Analytics Tips & Tricks weekly in our Knowledge Center and in upcoming newsletters! You can also sign up to get our Planning Analytics Tips & Tricks sent directly to your inbox!
Read more IBM Planning Analytics Tips & Tricks posts:
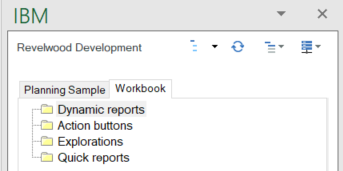
IBM Planning Analytics Tips & Tricks: PAx Task Pane Workbook Tab