Did you know that update 76 of IBM Planning Analytics allows you to customize background colors for data and header cells within your Planning Analytics Workspace (PAW) views?
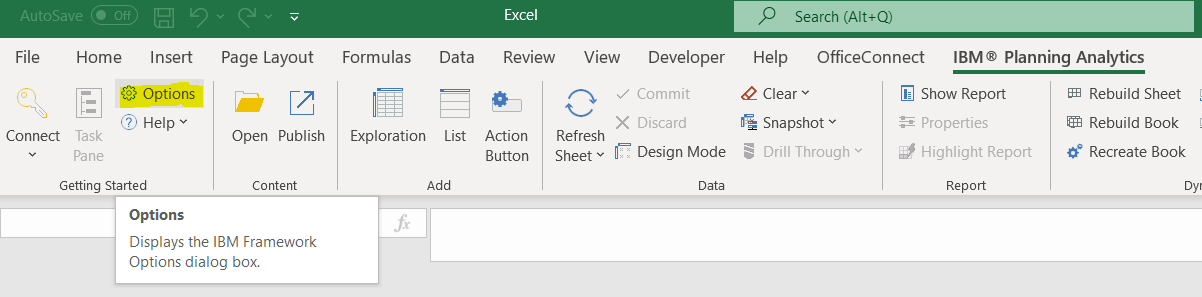
To customize these colors, click on a view within a page in PAW and open the “Properties” menu.
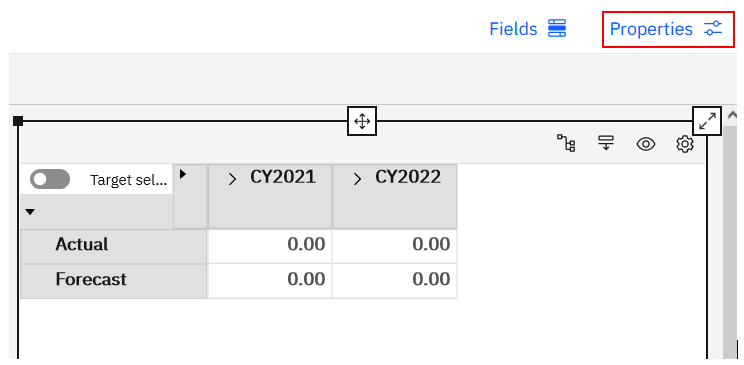
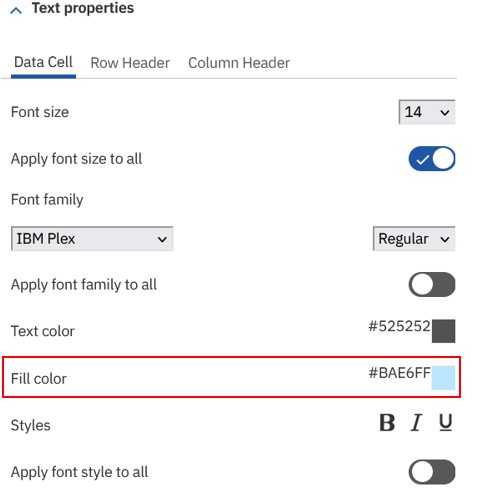
Within the “Properties” menu expand “Text Properties”. Within this section you will notice three subsections: “Data Cell”, “Row Header”, and “Column Header”. Each of these sections includes a setting called “Fill Color”, which defines the background color.
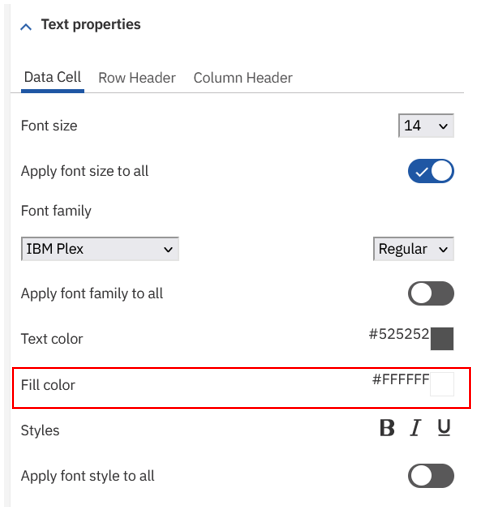
In this example, I will update the data cell background color to a light blue.
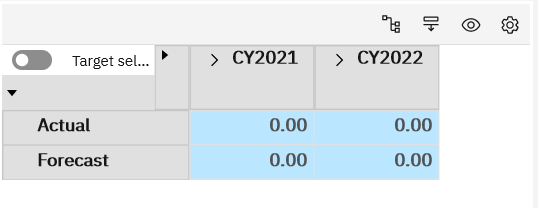
The data cells are now a light blue.
The same can be accomplished for the row and column headers, giving complete control over the colors in your PAW view.
Revelwood has worked with IBM Planning Analytics / TM1 for more than 27 years. We’ve partnered with hundreds of companies on the design, development, maintenance and updates of IBM Planning Analytics applications, across every industry. Have a challenge with Planning Analytics / TM1? We can help you!
Read more IBM Planning Analytics Tips & Tricks:
IBM Planning Analytics Tips & Tricks: Excel’s XMATCH Function
IBM Planning Analytics Tips & Tricks: Adding a New Entry to Index Cube via Dynamic Report