• Skip to main content
  • Skip to footer
Revelwood Logo

Revelwood

Your SUPER-powered WP Engine Site

  • Who We Are
    • About Us
      • Our Company
      • Our Team
      • Partners
    • Careers
      • Join Our Team
  • What We Do
    • Solutions
      • Workday Adaptive Planning
      • IBM Planning Analytics
      • BlackLine
    • Services
      • Implementation Services
      • Customer Care
        • Help Desk
        • System Administration as a Service
      • Training
        • Workday Adaptive Planning Training
        • IBM Planning Analytics / TM1 Training
    • Products
      • DataMaestro
      • LightSpeed
      • IBM Planning Analytics Utilities
  • How We Help
    • Use Cases
    • Client Success Stories
  • How We Think
    • Knowledge Center
    • Events
    • News
  • Contact Us

Revelwood

30 Years of Office of Finance Excellence—And We’re Just Getting Started

June 23, 2025 by Revelwood

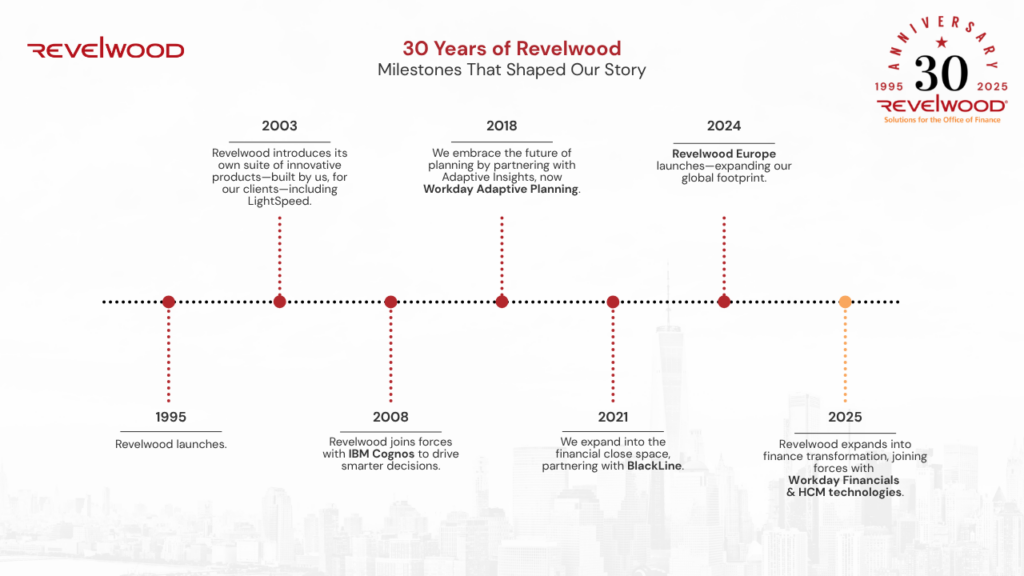
In 1995 two colleagues sat down and imagined a different kind of consulting firm—one laser-focused on helping Finance teams plan, analyze and make better decisions. That conversation between Ken Wolf and Dan Bernatchez, sparked by disillusionment with the status quo and energized by a growing market opportunity, gave rise to Revelwood.

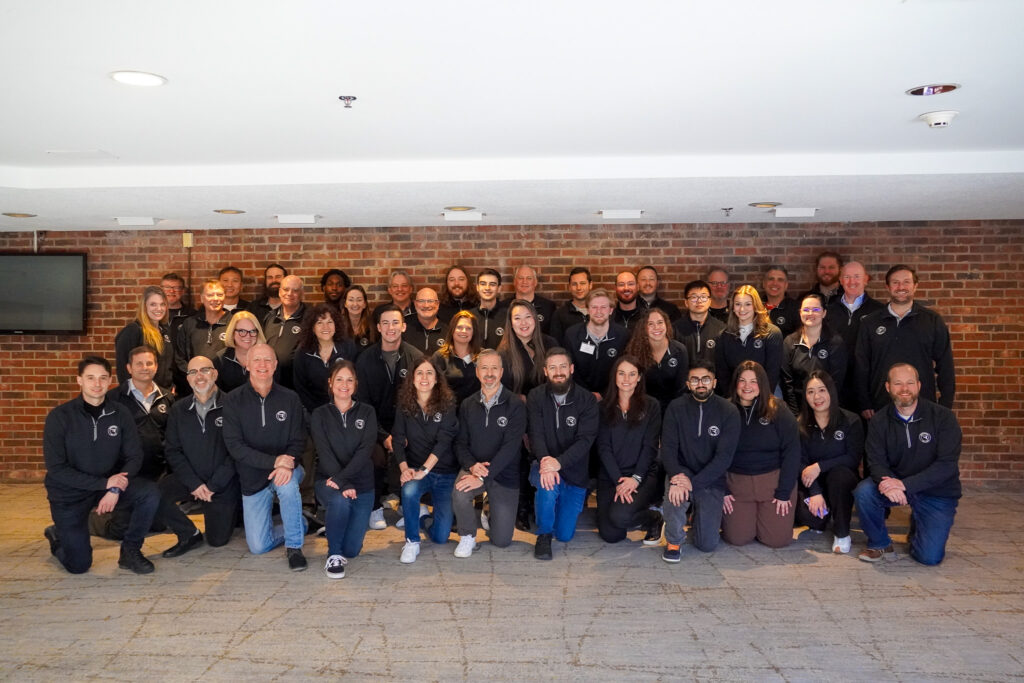
Thirty years later, we’re celebrating a milestone that reflects not just our longevity, but our continuous reinvention, our commitment to our clients and our passion for the Office of Finance.

The Origin Story: A Vision for Something Better

Revelwood wasn’t born in a boardroom. It was born from experience. At the time, Ken and Dan were consultants working with TM1 technology (then owned by Sinper Corporation) long before it became part of IBM Planning Analytics. They believed there was a smarter way to serve clients: by specializing, simplifying and staying true to core values.

They took a leap and founded Revelwood, choosing focus over breadth and deep expertise over being generalists. From day one, the goal was clear: build a firm that speaks the language of business and empowers Finance teams to lead with insight. Soon after Revelwood was established, Rob Gordy joined the partner team to strengthen the firm’s technical expertise and capabilities.

The Evolution: Staying True While Growing Smart

Revelwood’s early days were grounded in financial planning and analysis—what we now call FP&A. Over the years, we’ve embraced new technologies, added vendor partnerships and responded to tectonic shifts in the software landscape. We weathered transitions—from TM1’s move to from Sinper, to Applix, to Cognos and then to IBM.

Throughout the years we have made a conscious decision to focus on what made us successful: deep domain expertise in the Office of Finance. That decision led to new partnerships with Workday and BlackLine, positioning Revelwood as a multi-solution partner offering best-in-class tools for FP&A and financial close.

Internally, we evolved from a small consultancy to a scalable, growth-oriented company. Today, we have an international presence, a dedicated sales and marketing engine and a client success team — all built to serve our clients better and more efficiently.

What Sets Us Apart: Our Not-So-Secret Sauce

Revelwood is truly unique. Our “secret sauce” isn’t one thing—it’s a blend of:

  • Our core values: These shape our culture and are reflected in every decision and interaction, no matter how large or small. They are:
    • Be passionate.
    • It’s about the team.
    • Do the right thing.
    • Take pride in your work.
    • Take initiative.
    • We care.
  • Our people: We hire smart finance and accounting professionals, then layer in technology skills —resulting in real-world solutions that work.
  • Our brand promise: We speak business first. We deliver useware, not shelfware. And we’ve always got your back.
  • Our focus: We’re not trying to be everything to everyone. We know the Office of Finance and we live in that world every day.
  • Our growth mindset: While many firms stay small, we’ve invested in scale, structure and strategy. That’s helped us build lasting client relationships and earn accolades from partners like BlackLine, IBM and Workday.

The Road Ahead: Finance Transformation, End to End

As we look forward, the next phase of Revelwood’s journey is all about expanding our role in finance transformation. We will soon be launching our Workday Financials practice — complementing our long-standing expertise in planning, analytics, and financial close automation.

The goal? To support the entire Office of Finance with a full suite of integrated tools—from record to report, from plan to performance. Whether it’s IBM Planning Analytics, Workday Adaptive Planning, BlackLine or Workday Financials, Revelwood is uniquely positioned to guide organizations through end-to-end financial transformation.

Here’s to the Next 30

For 30 years, Revelwood has been in your corner — helping you navigate change, accelerate performance, and lead with confidence. We’re grateful to the clients, partners and teammates who’ve made this journey possible.

And we’re just getting started.

We’ve got your back—for the next 30 years and beyond.

Home » Revelwood

Filed Under: News & Events Tagged With: finance transformation, Financial Performance Management, Office of Finance, Revelwood, Workday Adaptive Planning

Offsite 2024: Investing in Our People

February 14, 2024 by Revelwood

News & Events

Each year we bring our team together for our corporate offsite. This year Revelwoodians came from near and far – from the Tri-State area near our New Jersey-based headquarters to the Greater Boston area, the West Coast (specifically, California and Washington), Florida and even Scotland. 

Offsite gives us an opportunity to learn, share, bond and have fun with each other. While the content varies year-to-year, the objective of our offsite stays the same – to reinforce our culture and create an environment to work better together.

“On one hand, offsite can be costly,” said Ken Wolf, CEO, Revelwood. “That includes not just direct costs, but the opportunity costs of taking two full billing days out of our monthly cycle. On the other hand – offsite is priceless. It serves as a time to bring together a largely remote organization, get the team away from the day-to-day work, and help them learn, help our clients and get to know each other better. We reinforce our core values, and most importantly, we have fun together.”

This year’s offsite included bringing a guest speaker from Princeton University to share his thoughts on Generative AI (artificial intelligence), the team meeting our new managing director for Europe, Jonathan Dunn and our new director for Latin America, Hector Osuna.  

“This was my first offsite,” said Shammah Momplaisir, FP&A consultant, Revelwood. “I really enjoyed it. It was a great balance of meetings, planned activities for bonding, and time to ourselves. One of the fun events was our AMBA (mini-basketball) tournament. I didn’t make it to the playoffs, so I sat with the scorekeepers. To make it even more fun, I decided to serve as the commentator for the tournament. It ramped up the energy – even though it was late at night.”

Mary Luchs, a senior consultant at Revelwood, enjoys the mix of work and fun. “Offsite reminds us to rely on each other,” commented Mary. “The informal aspect of offsite provides some of the most value – you get to talk to and hang out with people you don’t work with on a day-to-day basis. You can carpool to activities with other Revelwoodians you might not know well. It helps to create a sense of team purpose.”

One highlight of the annual meeting is our Core Value Awards ceremony. Our core values are a fundamental part of Revelwood’s culture, and we talk about them every day. Each and every Revelwoodian lives our core values. 

Before offsite, our leadership team identified individuals who stood out with respect to our core values. This year’s Core Values Awards ceremony recognized our team members who embody these values. Our Core Values are:

  • Be Passionate
  • Do the Right Thing
  • Take Initiative
  • It’s About the Team
  • Take Pride in Your Work
  • We Care

Some years – such as this year – the leadership team decides to recognize one individual as the Ideal Revelwoodian. This award is not given out every year – it’s for when someone goes far above and beyond expectations. This year we bestowed the award on Dave Miersch, our Workday Adaptive Planning practice leader.

“Our investment in offsite creates magic,” added Ken. “We come out of offsite with a better, smarter, more connected team. They are passionate about helping to make our clients successful, to grow our business, and to help us achieve our goals.”

Home » Revelwood

Filed Under: News & Events Tagged With: BlackLine, IBM Planning Analytics, Offsite, Revelwood, Workday Adaptive Planning

What Does Revelwood Do?

August 12, 2021 by Lisa Minneci Leave a Comment

Video

When you think of consumer companies, you might only think of them in terms of their flagship product or service. Coca-Cola sells soft drinks. McDonald’s sells hamburgers. Uber provides ride shares for people. Those companies actually do more than just what they are known for: Coca-Cola also offers Dasani, VitaminWater, Honest Kids, Gold Peak iced tea and more. McDonald’s is also known for its Filet-O-Fish and has now entered the competitive fried chicken market. In addition to offering ride shares, Uber’s services include food and goods delivery.

Many Revelwood clients think of us as their partner of choice to design and implement Office of Finance solutions based on IBM Planning Analytics and Workday Adaptive Planning. Like those consumer brands I mentioned, we do much more than that. We’ve recently added BlackLine to our best-of-breed portfolio and are looking forward to adding more world-class solutions for the Office of Finance.

We also deliver Customer Care solutions for managing and maintaining your Office of Finance systems.

Hear what our CEO, Ken Wolf, has to say about what Revelwood does and how we are enabling organizations to disrupt their companies, industries and the world.

Home » Revelwood

Filed Under: News & Events, Videos Tagged With: BlackList, Customer Care, IBM Cognos TM1, IBM Planning Analytics, ken wolf, Revelwood, Workday Adaptive Planning

IBM Planning Analytics Tips & Tricks: Introduction to Apps and Plans

March 16, 2021 by Revelwood Leave a Comment

As of version 58 of IBM Planning Analytics Workspace (PAW), IBM introduced new features called Applications and Plans. These are meant to guide business processes by centralizing and organizing required tasks to make sure that all steps are completed in the correct sequence.

To access the area, click on the Applications and Plans pane on the homepage when you first log onto PAW.

IBM Planning Analytics Workspace: Introduction to Apps and Plans

On the next page, you can create a new application or plan by clicking on the “Create” drop down and selecting the appropriate option.

IBM Planning Analytics Workspace: Introduction to Apps and Plans

Before you can add to your application or plan, you must enter a name.

IBM Planning Analytics Workspace: Introduction to Apps and Plans

For applications, you can add “sections” to your process. Each section corresponds to a step in your business process. You can add assets such as PAW views, websheets, or books for users to access easily. You can also assign PAW groups to each step to show who is responsible for completing that task.

IBM Planning Analytics Workspace: Introduction to Apps and Plans

Plans are similar to applications, but they also provide the ability to set due dates and allow for submissions as a form of approval or completion notice.

IBM Planning Analytics Workspace: Introduction to Apps and Plans

So when would you use each type?

  • Applications are designed to be used as a guide for set business processes that do not depend on multiple groups. Examples include CAR requests, monthly forecasting steps, cost center requests, or variance reviews.
  • Plans are for collaboration in which the steps are dependent upon each other or other groups. This is typically the annual budget process and special projects such as mergers and acquisitions which require steps to be completed in a timely manner.

IBM Planning Analytics, which TM1 is the engine for, is full of new features and functionality. Not sure where to start? Our team here at Revelwood can help. Contact us for more information at info@revelwood.com. And stay tuned for more Planning Analytics Tips & Tricks weekly in our Knowledge Center and in upcoming newsletters!

Read more IBM Planning Analytics Tips & Tricks:

IBM Planning Analytics Tips & Tricks: Creating Groups in PAW

IBM Planning Analytics Tips & Tricks: PAW Pass Context

IBM Planning Analytics Tips & Tricks: Home Button

Home » Revelwood

Filed Under: IBM Planning Analytics Tips & Tricks Tagged With: Budgeting Planning & Forecasting, enterprise performance management, Financial Performance Management, IBM Cognos TM1, IBM Planning Analytics, IBM Planning Analytics Workspace, IBM Planning Analytics Workspace apps, IBM Planning Analytics Workspace plans, Revelwood, TM1

IBM Planning Analytics Tips & Tricks: Planning Analytics Forecasting – Setting up the Forecast

March 9, 2021 by Revelwood Leave a Comment

This is part three in a three-part series on IBM Planning Analytics’ new feature, Forecasting. 

In our previous blog about IBM Planning Analytics’ new Forecasting feature, we reviewed the steps required to preview your forecast. Once previewed, you can then run your Forecast.

  1. Open a Planning Analytics Workspace (PAW) book and add a new cube view. Setting up the forecast in IBM Planning Analytics Forecasting
  2. Place the time dimension’s flat hierarchy alone on the columns. As of PAW version 2.0.60, you will no longer be required to display the entire hierarchy on the view. Instead, you will have the option to select the scope of the historical data used in the forecast.
  3. Select the context and row elements to forecast. For example:
    • Drag the account dimension on top of the source dimension to swap their positions.
    • Click on the version dimension to select a different version of the data from the drop-down list.
    • Double-click on the account dimension to select the row elements. Setting up the forecast in IBM Planning Analytics Forecasting

Your PAW cube view is now ready as a Planning Analytics Forecasting model.

IBM Planning Analytics, which TM1 is the engine for, is full of new features and functionality. Not sure where to start? Our team here at Revelwood can help. Contact us for more information at info@revelwood.com. And stay tuned for more Planning Analytics Tips & Tricks weekly in our Knowledge Center and in upcoming newsletters!

Read more IBM Planning Analytics Tips & Tricks:

IBM Planning Analytics Tips & Tricks: Planning Analytics Forecasting – Configuring the Time Dimension

IBM Planning Analytics Tips & Tricks: Planning Analytics Forecasting – Configuring the Forecast Settings

IBM Planning Analytics Tips & Tricks: Planning Analytics Forecasting – Previewing the Forecast

Home » Revelwood

Filed Under: IBM Planning Analytics Tips & Tricks Tagged With: Budgeting Planning & Forecasting, enterprise performance management, Financial Performance Management, IBM Cognos TM1, IBM Planning Analytics, IBM Planning Analytics Forecasting, Planning & Forecasting, Planning Analytics tips, Planning Analytics Tips & Tricks, Revelwood, setting up forecast + Planning Analytics, TM1

IBM Planning Analytics Tips & Tricks: The Waterfall Chart

January 19, 2021 by Lee Lazarow Leave a Comment

IBM Planning Analytics Workspace (PAW) includes various visualizations that can be used to view your data. One of these visualizations entails a chart called a waterfall chart. This type of chart will help you show the components of a summarized number and is very helpful in determining which values are beneficial to the total and which values are detrimental.

The image below shows an exploration and its corresponding waterfall chart.

IBM Planning Analytics Tips & Tricks: The Waterfall Diagram
  • The chart shows information about each region while also defining each region as a positive (green) or negative (red) amount, which makes it easy to determine what is adding to the total and what is reducing the total.
  • The chart makes it easy to compare regions against each other, which allows you to quickly see that the Northeast gross profit is much larger than the West.
  • The chart allows users to look at the pieces as a rough percentage of the total, which lets you see that the Northeast accounts for more than half of the total.

PAW also allows you to customize various aspects of the chart, including colors for each bar.

Understanding the waterfall diagram in IBM Planning Analytics

The combination of an exploration and a waterfall chart can be used as the starting point for a user friendly dashboard in PAW.

IBM Planning Analytics, which TM1 is the engine for, is full of new features and functionality. Not sure where to start? Our team here at Revelwood can help. Contact us for more information at info@revelwood.com. And stay tuned for more Planning Analytics Tips & Tricks weekly in our Knowledge Center and in upcoming newsletters!

Read more IBM Planning Analytics Tips & Tricks:

IBM Planning Analytics Tips & Tricks: IBM Planning Analytics Workspace Chart Types

IBM Planning Analytics Tips & Tricks: Visualizing Data into Pie Charts

IBM Planning Analytics Tips & Tricks: Hiding Dimensions in Planning Analytics Workspace

Home » Revelwood

Filed Under: IBM Planning Analytics Tips & Tricks Tagged With: Budgeting Planning & Forecasting, Financial Performance Management, IBM Cognos TM1, IBM Planning Analytics, IBM Planning Analytics Workspace, lee lazarow, Planning Analytics tips, Planning Analytics Tips & Tricks, Planning Analytics Workspace, Revelwood, TM1

IBM Planning Analytics Tips & Tricks: Excel TYPE Function

January 12, 2021 by Lee Lazarow Leave a Comment

Have you ever referenced a list in Excel and needed to know whether each value was a number or a string? This may be required when another function depends on the type of value in each cell.

Excel has a function called TYPE that will give you this information. The function contains a single parameter, which is simply the cell you want to check. The formula will output a number that defines the type of value such as number, text, logical value or an error.

Here are results from four iterations of the TYPE formula:

IBM Planning Analytics Tips & Tricks: Excel Type

You can then use the type result within an IF statement to perform various functions.

The TYPE function will not determine whether a cell contains a formula. TYPE only determines the type of the resulting, or displayed, value. If value is a cell reference to a cell that contains a formula, TYPE returns the type of the formula’s resulting value.

This approach will help you when determining the use of IBM Planning Analytics formulas such as DBS vs. DBSS.

IBM Planning Analytics, which TM1 is the engine for, is full of new features and functionality. Not sure where to start? Our team here at Revelwood can help. Contact us for more information at info@revelwood.com. And stay tuned for more Planning Analytics Tips & Tricks weekly in our Knowledge Center and in upcoming newsletters!

Read more Excel tips & tricks:

IBM Planning Analytics Tips & Tricks: Excel Keyboard Navigation

IBM Planning Analytics Tips & Tricks: Excel’s FILTER Function

IBM Planning Analytics Tips & Tricks: Excel’s CONCAT and TEXTJOIN Functions

Home » Revelwood

Filed Under: IBM Planning Analytics Tips & Tricks Tagged With: enterprise performance management, Excel, Excel tips & tricks, Financial Performance Management, IBM Cognos TM1, IBM Planning Analytics, lee lazarow, Planning Analytics tips, Planning Analytics Tips & Tricks, Revelwood, TM1

IBM Planning Analytics Tips & Tricks: Excel Keyboard Navigation

January 5, 2021 by Lee Lazarow Leave a Comment

Have you ever wanted to quickly go to the last used cell within a spreadsheet but did not know how? Have you ever wanted to determine where the next available row or column resides? Have you ever wondered why a spreadsheet with only a few cells of data may appear as a large file? All these answers can be provided with a single keystroke combination.

Pressing Ctrl and End at the same time will bring you to the last cell within a spreadsheet that Excel is referencing. The definition of “last” entails the rightmost column and the lowest used row on the worksheet. The last cell may not always contain data, but it will always be registered by Excel as something that is utilizing memory.

Here are some other keystroke combinations that will help you quickly navigate around your spreadsheet:

  • Ctrl and Home at the same time: this will bring you to the first cell (A1) in the worksheet.
  • End then an arrow key: this will bring you to the next empty value in any direction. For example, pressing End and then the down arrow will bring you to next empty cell in the column where your cursor currently resides.
  • Ctrl and PageUp : this will bring you to the previous sheet in the workbook.
  • Ctrl and PageDn: this will bring you to the next sheet in the workbook.

Keyboard shortcuts can easily help you navigate your Excel files and help you determine the “ending” cell within a spreadsheet.  This will be useful in situations such as dynamic reports where rows and columns are automatically generated via automation.

IBM Planning Analytics, which TM1 is the engine for, is full of new features and functionality. Not sure where to start? Our team here at Revelwood can help. Contact us for more information at info@revelwood.com. And stay tuned for more Planning Analytics Tips & Tricks weekly in our Knowledge Center and in upcoming newsletters!

Read more Excel Tips & Tricks:

IBM Planning Analytics Tips & Tricks: Learn the Excel CELL Formula

IBM Planning Analytics Tips & Tricks: Excel’s IFS Function

IBM Planning Analytics Tips & Tricks: Excel LET Function

Home » Revelwood

Filed Under: IBM Planning Analytics Tips & Tricks Tagged With: enterprise performance management, Excel, Excel tips & tricks, Financial Performance Management, IBM Cognos TM1, IBM Planning Analytics, lee lazarow, Planning Analytics tips, Planning Analytics Tips & Tricks, Revelwood, TM1

IBM Planning Analytics Tips & Tricks: Alternative Row Formats for Excel Reports

November 10, 2020 by Lee Lazarow Leave a Comment

Tips & Tricks

In the early days of computing, printers often used paper that had alternating white and green areas which allowed the reader to easily follow a line of text across the page. This was known as “green bar” paper.  While we no longer use this type of paper, the concept is still applicable for situations where your output contains many columns that are hard to follow.

You can create this approach by using alternate row formats within your Excel reports.  This is done by combining two Excel formulas:

  • The ROW formula returns the row number for a cell reference. For example, ROW(K5) returns the number 5 since the cell is in the 5th row of the spreadsheet.
  • The MOD formula returns the remainder of two numbers after division. For example, MOD(9,2) returns the number 1.

When combined, the following formula will result in either a 1 or a 0:

=MOD(ROW(cell),2)

From there, you can use conditional formatting to define the fill colors. If you are doing this in standard Excel, then you can copy the formula throughout the applicable area.  If you are doing this within a dynamic report, then you can use it within the formatting area.

This approach allows you to make your wide reports easier to read. This also means that you can recreate the green bar format while you pull out your dot matrix printer and watch classic movies such as Wargames!

IBM Planning Analytics, which TM1 is the engine for, is full of new features and functionality. Not sure where to start? Our team here at Revelwood can help. Contact us for more information at info@revelwood.com. And stay tuned for more Planning Analytics Tips & Tricks weekly in our Knowledge Center and in upcoming newsletters!

Read more IBM Planning Analytics Tips & Tricks posts:

IBM Planning Analytics Tips & Tricks: Learn the Excel CELL Formula

IBM Planning Analytics Tips & Tricks: Excel’s IFS Function

IBM Planning Analytics Tips & Tricks: Excel’s LET Function

Home » Revelwood

Filed Under: IBM Planning Analytics Tips & Tricks Tagged With: Budgeting, Budgeting Planning & Forecasting, Financial Performance Management, IBM Cognos TM1, IBM Planning Analytics, lee lazarow, Planning & Forecasting, Planning & Reporting, Planning Analytics Tips & Tricks, Revelwood, TM1

  • Page 1
  • Page 2
  • Page 3
  • Interim pages omitted …
  • Page 8
  • Go to Next Page »

Footer

Revelwood Overview

Revelwood helps finance organizations close, consolidate, plan, monitor and analyze business performance. As experts in solutions for the Office of Finance, we partner with best-in-breed software companies by applying best practices guidance and our pre-configured applications to help businesses achieve their full potential.

EXPERTISE

  • Workday Adaptive Planning
  • IBM Planning Analytics
  • BlackLine

ABOUT

  • Who We Are
  • What We Do
  • How We Help
  • How We Think
  • Privacy

CONNECT

World Headquarters

Florham Park, NJ | 201 984 3030

European Headquarters

London & Edinburgh | +44 (0)131 240 3866

Latin America Office

Miami, FL | 201 987 4198

Email
info@revelwood.com

Copyright © 2025 · Revelwood Inc. All rights reserved. Revelwood® and the Revelwood logo are registered marks of Revelwood Inc.