• Skip to main content
  • Skip to footer
Revelwood Logo

Revelwood

Your SUPER-powered WP Engine Site

  • Who We Are
    • About Us
      • Our Company
      • Our Team
      • Partners
    • Careers
      • Join Our Team
  • What We Do
    • Solutions
      • Workday Adaptive Planning
      • IBM Planning Analytics
      • BlackLine
    • Services
      • Implementation Services
      • Customer Care
        • Help Desk
        • System Administration as a Service
      • Training
        • Workday Adaptive Planning Training
        • IBM Planning Analytics / TM1 Training
    • Products
      • DataMaestro
      • LightSpeed
      • IBM Planning Analytics Utilities
  • How We Help
    • Use Cases
    • Client Success Stories
  • How We Think
    • Knowledge Center
    • Events
    • News
  • Contact Us

Analytics

IBM Planning Analytics Tips & Tricks: Trimming Picklists

November 26, 2019 by Lee Lazarow Leave a Comment

Tips & Tricks

Did you know that IBM Planning Analytics includes a feature that helps trim the list of choices in a picklist as you type? There are many different ways to create picklists in TM1/Planning Analytics and Revelwood has previously written about creating picklist cubes.

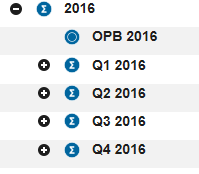
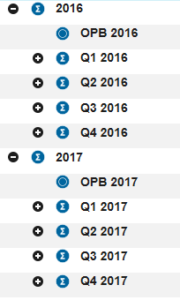
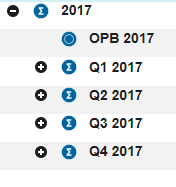
Here is an exploration that uses a picklist. This list entails all base level elements of a dimension. As you can see, there are six options to choose from.

IBM Planning Analytics Tips & Tricks: Trimming Picklists

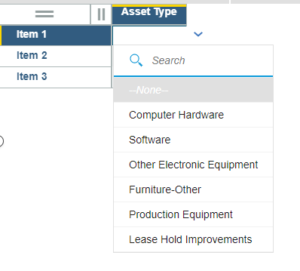
I can select a value by clicking on an element from the list, which is great when I have a small list like this. But what if I have hundreds of elements in the list? The list can quickly become hard to navigate.

I can instead type in the “Search” area. If I type the letter “F” then my list is reduced to the only elements that contain the letter F.

IBM Planning Analytics Tips: Trimming Picklists

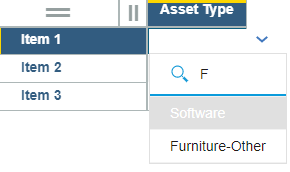
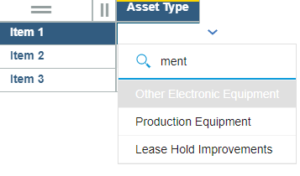
You can see that the list does not just look at the first character … it instead looks at all characters. As another example, if I instead type the letters “ment” then the list will trim down to anything that contains these letters within the full string.

IBM Planning Analytics Tricks: Trimming Picklists

This approach can help your end users when selecting cost centers, employee names, or other long lists.

IBM Planning Analytics, which TM1 is the engine for, is full of new features and functionality. Not sure where to start? Our team here at Revelwood can help. Contact us for more information at info@revelwood.com. And stay tuned for more Planning Analytics Tips & Tricks weekly in our Knowledge Center and in upcoming newsletters!

Want to get our Planning Analytics Tips & Tricks delivered to your inbox every Tuesday? Sign up to get our weekly email of just the week’s tip!

Learn more about picklists in IBM Planning Analytics:

IBM Planning Analytics Tips & Tricks: Creating TM1/Planning Analytics Picklist Cubes

IBM Planning Analytics Tips & Tricks: When to Build Multiple Cubes

Home » Analytics » Page 9

Filed Under: IBM Planning Analytics Tips & Tricks Tagged With: Analytics, Beyond Budgeting, Budgeting, Budgeting Planning & Forecasting, Financial Performance Management, IBM Planning Analytics, Planning & Forecasting, Planning & Reporting, TM1

IBM Planning Analytics Tips & Tricks: Simplifying Dimension Maintenance

November 19, 2019 by Lisa Minneci Leave a Comment

Videos

Watch our latest IBM Planning Analytics Tips & Tricks video to learn how to simplify dimension maintenance in Planning Analytics. Once you master these easy techniques, you’ll be able to do all of your dimension maintenance from the Planning Analytics Workspace (PAW) administration screen.

In this video, Lee Lazarow, Revelwood’s FP&A technology director, demonstrates how to maintain your dimensions in PAW. Lee shows you how to move elements using both a standard drag-and-drop approach and a wizard-based approach. You’ll also see how to create new hierarchies and how to manipulate your dimension structure without going to a different screen.

By merging all aspects of a dimension together, you can do all your dimension maintenance from the PAW administration screen.

IBM Planning Analytics, which TM1 is the engine for, is full of new features and functionality. Not sure where to start? Our team here at Revelwood can help. Contact us for more information at info@revelwood.com. And stay tuned for more Planning Analytics Tips & Tricks weekly in our Knowledge Center and in upcoming newsletters!

Want to get our Planning Analytics Tips & Tricks delivered to your inbox every Tuesday? Sign up to get our weekly email of just the week’s tip!

Check out our IBM Planning Analytics Tips & Tricks video series:

Regions with Rules in IBM Planning Analytics

Bookmarking in IBM Planning Analytics

Snap Commands in IBM Planning Analytics

Pivoting & Selecting Shortcut in IBM Planning Analytics

Home » Analytics » Page 9

Filed Under: IBM Planning Analytics Tips & Tricks, Videos Tagged With: Analytics, Budgeting, Budgeting Planning & Forecasting, Financial Performance Management, IBM Cognos TM1, IBM Planning Analytics, Planning & Forecasting, Planning & Reporting, Planning Analytics Tips & Tricks, Planning Analytics video, Planning Analytics Workspace, Revelwood, TM1, video

IBM Planning Analytics Tips & Tricks: PAx Control Objects

November 12, 2019 by Lee Lazarow Leave a Comment

Tips & Tricks

IBM Planning Analytics uses cubes to store metadata information such as security and attribute information. These automatically generated cubes are called control cubes (which I sometimes call “squiggle cubes”) and begin with a prefix of a right curly brace.

Server Explorer used a toggle approach within the View menu to allow users to either view or hide these cubes. Planning Analytics for Excel (PAx) also includes a toggle approach that can be used via the following steps:

1) Ensure that the task pane is showing by selecting the icon within the IBM Planning Analytics ribbon

IBM Planning Analytics Tips & Tricks: PAX Control Objects

2) Click on the icon for “show and hide”

Understanding PAx Control Objects - IBM Planning Analytics Tips & Tricks

3) Select the option for “show control objects”

How to use PAx Control Objects - IBM Planning Analytics Tips & Tricks

Once selected, the list of cubes will expand and will display the control cubes. This list can be controlled via cube security to limit which control cubes can be seen by the user.

IBM Planning Analytics, which TM1 is the engine for, is full of new features and functionality. Not sure where to start? Our team here at Revelwood can help. Contact us for more information at info@revelwood.com. And stay tuned for more Planning Analytics Tips & Tricks weekly in our Knowledge Center and in upcoming newsletters!

Read more IBM Planning Analytics Tips & Tricks:

IBM Planning Analytics Tips & Tricks: Troubleshooting Planning Analytics for Excel (PAx)

IBM Planning Analytics Tips & Tricks: The Ranked Report

IBM Planning Analytics Tips & Tricks: The Replace and Close Feature in PAx

Home » Analytics » Page 9

Filed Under: IBM Planning Analytics Tips & Tricks Tagged With: Analytics, Budgeting, Budgeting Planning & Forecasting, Financial Performance Management, IBM Cognos TM1, IBM Planning Analytics, PAx, Planning & Forecasting, Planning & Reporting, Planning Analytics for Excel, TM1

IBM Planning Analytics Tips & Tricks: Learn How to Use the Pivoting and Selecting Shortcut

November 5, 2019 by Lisa Minneci Leave a Comment

Video

Our latest IBM Planning Analytics Tips & Tricks tutorial video explains how and why you should use the pivoting and selecting shortcut. In this short video, Revelwood’s FP&A Technology Director, Lee Lazarow, demonstrates how to pivot in exploration and select an element in one move – saving yourself a keystroke.

By combining these tasks into one single action, it’s now faster to navigate through your data!

IBM Planning Analytics, which TM1 is the engine for, is full of new features and functionality. Not sure where to start? Our team here at Revelwood can help. Contact us for more information at info@revelwood.com. And stay tuned for more Planning Analytics Tips & Tricks weekly in our Knowledge Center and in upcoming newsletters!

Watch more of Lee’s tips in our IBM Planning Analytics Tips & Tricks video series:

IBM Planning Analytics Tips & Tricks: Learn how to use Snap Commands in IBM Planning Analytics

IBM Planning Analytics Tips & Tricks: Bookmarks in IBM Planning Analytics Workspace

IBM Planning Analytics Tips & Tricks: Regions with Rules

Home » Analytics » Page 9

Filed Under: IBM Planning Analytics Tips & Tricks, Videos Tagged With: Analytics, demo, Financial Performance Management, IBM Cognos TM1, IBM Planning Analytics, lee lazarow, pivoting, planning analytisc tips & tricks, Revelwood, TM1, tutorial, video

The FP&A Alignment Gap and How to Avoid It

October 31, 2019 by Ken Wolf Leave a Comment

We buy new software solutions expecting that we made the best choice in technologies and service providers, and that we’ll get years of productive use out of them. And, we were right… at the time. Then, we ask ourselves, “Why are my users complaining that the software stinks? That performance is unbearably slow, or that it simply doesn’t work for them anymore?” It’s something we at Revelwood call the Alignment Gap.

When we first rollout our new software solution, it’s in perfect alignment with our business needs. We gathered our current business requirements and probably worked with a consulting firm or service provider to translate those requirements into the ideal solution. At the point of rollout, the gap between our needs and the solution is hardly visible. However, over time several things happen:

  • First, our business needs evolve. We enter new markets, make acquisitions and reorganize ourselves to address these changes. Perhaps we start to outgrow our original requirements.
  • Second, we start to tinker with the solution to make it work better for us. These one-off tweaks start to look like holes in the dam that we’re plugging without any overall plan on how it should all fit together.
  • Finally, the technology itself improves, but we fail to take a step back and figure out how we can take advantage of its new features and capabilities.
The FP&A Alignment Gap

These dynamics create an ever-widening gap between our needs and the solution we were once so excited about. The wider that gap is, the greater levels of dissatisfaction we experience from our users and by the organization as a whole. Eventually, we get to the point where nobody is happy, and users begin to trash talk the software itself, rather than how we’re misusing it. So, how do we keep the Alignment Gap as narrow as possible?

The biggest mistake companies make is that they don’t ensure an ongoing review and assessment of their software solutions so that an Alignment Gap never occurs in the first place. Imagine never going to the doctor for a check-up, but expecting that you’ll remain in perfect health forever. Imagine not bringing your car in for service periodically to make sure that you don’t break down when you’re out on the open road. It is critical to examine your software solutions on a regular basis to ensure they continue to meet your ever-changing business needs. And, you must invest in incremental improvements to reflect those needs and keep your solution current and relevant. These incremental changes will cost a lot less than the impact of low user adoption, unreliable results and the effort required to revisit the marketplace and invest in a whole new technology platform to solve the problem. Chances are, your current technology is not the problem… it’s how you’re using it!

Fortunately, Revelwood has a service offering for FP&A solutions that eliminates the  Alignment Gap. It’s called Performance Tune-Up and involves a thorough review of your solution at an appropriate frequency to ensure that it continues to operate efficiently and meets your changing business needs.

Don’t let the Alignment Gap erode the health of your FP&A operation. Talk to us today about our Performance Tune-up service.

Home » Analytics » Page 9

Filed Under: FP&A Done Right Tagged With: Analytics, Financial Performance Management, FP&A, FP&A done right, ken wolf, Revelwood

IBM Planning Analytics Tips & Tricks: New Excel Feature – XLOOKUP

October 29, 2019 by Lee Lazarow Leave a Comment

Tips & Tricks

Did you know Excel has a new feature called XLOOKUP?

For those of you who read these blogs regularly, you know that much of the focus is placed on IBM Planning Analytics Tips & Tricks.  However, I periodically also like to pass along new information about other planning and reporting aspects that impact your day-to-day tasks.

The VLOOKUP function has been around since Excel released version 1.0 in 1985. While VLOOKUP is one of the most widely used functions in Excel, there are some limitations:

  • Finding an “approximate” match
  • How to easily add columns in the search range
  • Define a search value in the middle of the range (e.g., not as the first column)
  • Starting a search at the bottom of your list without having to re-sort the data table

Microsoft recently announced the addition of a new function called XLOOKUP that is designed to simplify the lookup approach while merging functions such as VLOOKUP, HLOOKUP, INDEX and MATCH into a single function. The function is written as:

XLOOKUP(lookup_value,lookup_array,return_array,[match_mode],[search_mode])

lookup value: the value you are looking for (the same as VLOOKUP)

lookup_array: the lookup column (the same as VLOOKUP)

return_array: the results column (the same as VLOOKUP)

match_mode: This is an optional parameter that determines what kind of match to find.  The options include an exact match, an exact match or the next smaller item, an exact match or the next larger item, or a wildcard search.

search_mode: This is an optional parameter that allows you to determine whether the search happens from first-to-last or from last-to-first.

This new approach will make searching easier by not having to repeatedly modify your search table while also adding new functionality for tasks such as looking up a tax rate within a range of results.

There are many instances where the inclusion of Excel functions can help further your analytics. XLOOKUP is just one example.

IBM Planning Analytics, which TM1 is the engine for, is full of new features and functionality. Not sure where to start? Our team here at Revelwood can help. Contact us for more information at info@revelwood.com. And stay tuned for more Planning Analytics Tips & Tricks weekly in our Knowledge Center and in upcoming newsletters!

Home » Analytics » Page 9

Filed Under: IBM Planning Analytics Tips & Tricks Tagged With: Analytics, Beyond Budgeting, Budgeting, Budgeting Planning & Forecasting, Excel, Excel tips & tricks, Financial Performance Management, IBM Cognos TM1, IBM Planning Analytics, new excel feature, Planning & Forecasting, Planning & Reporting, Revelwood, TM1, XLOOKUP

IBM Planning Analytics Tips & Tricks: Learn how to use Snap Commands in IBM Planning Analytics

October 22, 2019 by Lisa Minneci Leave a Comment

Tips & Tricks

IBM Planning Analytics has a feature, snap commands, that simplifies various routine tasks. In our latest IBM Planning Analytics Tips & Tricks video, Revelwood’s FP&A Technical Director, Lee Lazarow demonstrates how snap commands in Planning Analytics allow you to change computer jargon into natural language wording.

In this video, Lee takes you through an example looking at operating expenses. He explains how Planning Analytics has built-in intelligence that is smart enough to understand typos or give you a list of options.

Watch Snap Commands in IBM Planning Analytics and learn:

  • How to turn on snap commands in the Planning Analytics Workspace (PAW) ribbon
  • How to use simple snap commands
  • How to hide a column

Snap commands simplify Planning Analytics, making your life easier!

IBM Planning Analytics, which TM1 is the engine for, is full of new features and functionality. Not sure where to start? Our team here at Revelwood can help. Contact us for more information at info@revelwood.com. And stay tuned for more Planning Analytics Tips & Tricks weekly in our Knowledge Center and in upcoming newsletters!

Check out our IBM Planning Analytics Tips & Tricks video series:

Regions with Rules in IBM Planning Analytics

Bookmarking in IBM Planning Analytics

Home » Analytics » Page 9

Filed Under: IBM Planning Analytics Tips & Tricks, Videos Tagged With: Analytics, Beyond Budgeting, Budgeting, Budgeting Planning & Forecasting, Financial Performance Management, IBM Cognos TM1, PAW, Planning & Forecasting, Planning & Reporting, Planning Analytics Tips & Tricks, Planning Analytics Workspace, snap commands, TM1

IBM Planning Analytics Tips & Tricks: The New Set Editor

October 15, 2019 by Lee Lazarow Leave a Comment

Tips & Tricks

IBM Planning Analytics contains a new set editor that makes it easy to manipulate the elements in a subset. This approach allows you to quickly add a single element, add a group of elements, or replace an existing set of elements.

Once inside the set editor, you will see three buttons that are used to move elements from the left “selectable” side to the right “selected” side:

IBM Planning Analytics Tips & Tricks: PA Set Editor

The first step is to define the insertion approach. This approach allows you to enter a single element (member only) or a set of elements. These options include the following:

Using the IBM Planning Analytics Set Editor

Once an approach is defined, you can either append to the existing set or you can replace the existing set. Assume we start with the following layout:

How to use the IBM Planning Analytics Set Editor

Inserting the children of 2017 will result in the following set:

Learn how to use the IBM Planning Analytics set editor

This approach added the 2017 element and the immediate children to the existing set.

Replacing the children of 2017 will result in the following set:

Using the new set editor in IBM Planning Analytics

This approach removed the 2016 elements and replaced them with the immediate children of 2017.

This new approach in Planning Analytics will save you time by merging multiple steps into a single click.

IBM Planning Analytics, which TM1 is the engine for, is full of new features and functionality. Not sure where to start? Our team here at Revelwood can help. Contact us for more information at info@revelwood.com. And stay tuned for more Planning Analytics Tips & Tricks weekly in our Knowledge Center and in upcoming newsletters!

Read more IBM Planning Analytics Tips & Tricks

IBM Planning Analytics Tips & Tricks: PA Modeling – The Setting Editor

IBM Planning Analytics Tips & Tricks: PA Modeling – The Dimensions Editor

IBM Planning Analytics Tips & Tricks: The Planning Analytics Workspace Editor – Part I

IBM Planning Analytics Tips & Tricks: The Planning Analytics Workspace Editor – Part II

Home » Analytics » Page 9

Filed Under: IBM Planning Analytics Tips & Tricks Tagged With: Analytics, Beyond Budgeting, Budgeting, Budgeting Planning & Forecasting, Financial Performance Management, IBM Cognos TM1, IBM Planning Analytics, Planning & Forecasting, Planning & Reporting, planning analytics new features, TM1

Revelwood Named Adaptive Insights Gold Solution Provider

October 10, 2019 by Brian Combs Leave a Comment

We’re excited to share that Revelwood is now an Adaptive Insights Gold Solution Provider! We earned our badge by growing our Adaptive Insights practice and achieving several milestones in Adaptive Insights’ updated FY2020 Partner Program.

“The Revelwood team goes above and beyond to ensure successful implementations for Adaptive Insights Business Planning Cloud, and their new Gold Solution Provider status is proof of the expertise and focus of their team,” said Mel Zeledon, vice president worldwide channels and alliances, Adaptive Insights. “Revelwood’s passion and commitment to its partnership with Adaptive Insights and dedication to the success of our joint customers results in fast time to value—and that’s key for today’s organizations undergoing digital transformation projects.”

In order to become a Gold-level partner, Revelwood had to reach a higher threshold of cumulative net-new Annual Recurring Revenue (ARR) from client engagements.  As Mel mentions, our team is committed to that goal – clearly demonstrating how important this partnership is to us.

Revelwood is an Adaptive Insight's Gold Solution Partner

As part of our journey toward a Gold partnership, the Revelwood team earned additional sales, product and implementation, Level 1 support, and customer success certifications. These certifications are more than a matter of just “passing some tests” – they ensure and validate that the team members in our Adaptive Insights practice have the latest product knowledge and best practices to ensure successful implementations.

Our Adaptive Insights practice has significant momentum behind it – and it’s going to continue as we move forward.  I am excited to see where this takes us.  Next stop…Platinum!

Learn more about Revelwood’s partnership with Adaptive Insights:

Revelwood Named Adaptive Insights Partner Rising Star of the Year

Revelwood Launches Adaptive Insights Practice

Home » Analytics » Page 9

Filed Under: Awards & Recognition Tagged With: Adaptive Insights, Analytics, Financial Performance Management, Revelwood

  • « Go to Previous Page
  • Page 1
  • Interim pages omitted …
  • Page 7
  • Page 8
  • Page 9
  • Page 10
  • Page 11
  • Interim pages omitted …
  • Page 26
  • Go to Next Page »

Footer

Revelwood Overview

Revelwood helps finance organizations close, consolidate, plan, monitor and analyze business performance. As experts in solutions for the Office of Finance, we partner with best-in-breed software companies by applying best practices guidance and our pre-configured applications to help businesses achieve their full potential.

EXPERTISE

  • Workday Adaptive Planning
  • IBM Planning Analytics
  • BlackLine

ABOUT

  • Who We Are
  • What We Do
  • How We Help
  • How We Think
  • Privacy

CONNECT

World Headquarters

Florham Park, NJ | 201 984 3030

European Headquarters

London & Edinburgh | +44 (0)131 240 3866

Latin America Office

Miami, FL | 201 987 4198

Email
info@revelwood.com

Copyright © 2025 · Revelwood Inc. All rights reserved. Revelwood® and the Revelwood logo are registered marks of Revelwood Inc.