• Skip to main content
  • Skip to footer
Revelwood Logo

Revelwood

Your SUPER-powered WP Engine Site

  • Who We Are
    • About Us
      • Our Company
      • Our Team
      • Partners
    • Careers
      • Join Our Team
  • What We Do
    • Solutions
      • Workday Adaptive Planning
      • IBM Planning Analytics
      • BlackLine
    • Services
      • Implementation Services
      • Customer Care
        • Help Desk
        • System Administration as a Service
      • Training
        • Workday Adaptive Planning Training
        • IBM Planning Analytics / TM1 Training
    • Products
      • DataMaestro
      • LightSpeed
      • IBM Planning Analytics Utilities
  • How We Help
    • Use Cases
    • Client Success Stories
  • How We Think
    • Knowledge Center
    • Events
    • News
  • Contact Us

enterprise performance management

Workday Adaptive Planning Tips & Tricks: Excel Substitute

March 3, 2021 by Michelle Song Leave a Comment

We have something different for today’s Workday Adaptive Planning Tips & Tricks post – an Excel tip! Our Adaptive Planning users also use Excel, so we thought they’d find this helpful.

Have you ever wanted to get rid of spaces in some of your Excel cells? Maybe you do not want a cell to have separate words and instead want to use an underscore character. Or maybe you are in a situation where you want to adjust a prefix for a certain range of cells. You can use Excel’s find and replace functionality, but this approach could lead to a time consuming effort if you want to pick and choose the cells where it applies.

Excel’s SUBSTITUTE function can help you solve this problem. The SUBSTITUTE function is used to find a specific set of characters and replace it with something else while also giving you the ability to define details within cells.

The syntax of the function is:

=SUBSTITUTE (text, old_text, new_text)
  • text
    • This is the source that will be changed; this is typically a cell reference.
  • old_text
    • This is the subtext that will be replaced.
  • new_text
    • This is what will replace the old subtext

If the cell in A5 consists of “Happy Birthday” then it can be updated to “Happy_Birthday” via the following:

=SUBSTITUTE (A5, “ “, “_”)

In addition, the parameter that defines the new text can also be a cell reference.  This gives you the ability to quickly change the results of a large set of data by simply updating a single cell.

This approach will allow you to quickly find and replace characters within specific cells instead of having to manually go through a set of cells via Excel’s find and replace functionality.

The team at Revelwood has been recognized by Adaptive for its thought leadership in the space, commitment to its Adaptive Insights practice, and its rapid achievements of milestones. Visit Revelwood’s Knowledge Center for our Adaptive Insights Tips & Tricks or sign up here to get our Adaptive Insights Tips & Tricks delivered directly to your inbox. Not sure where to start with Adaptive Insights? Our team here at Revelwood can help! Contact us info@revelwood.com for more information.

Read more Workday Adaptive Planning Tips & Tricks:

Workday Adaptive Planning Tips & Tricks: Override Formulas in Sheets

Workday Adaptive Planning Tips & Tricks: Trigger for a Cube Calculated Account

Workday Adaptive Planning Tips & Tricks: Alternate Time Tree

 
Home » enterprise performance management » Page 6

Filed Under: Workday Adaptive Planning Tips & Tricks Tagged With: Adaptive Insights, adaptive insights tips & tricks, enterprise performance management, Excel, Excel tips & tricks, Financial Performance Management, Workday Adaptive Planning, Workday Adaptive Planning Tips & Tricks

IBM Planning Analytics Tips & Tricks: Planning Analytics Forecasting – Previewing the Forecast

March 2, 2021 by Nina Inverso Leave a Comment

This is part two of a three-part series on IBM Planning Analytics new Forecasting feature. 

In our first blog about Planning Analytics’ new Forecasting feature, we reviewed the steps required to configure your forecast. Once configured, you can then preview your forecast before to get a better idea of the results prior to populating the cube.

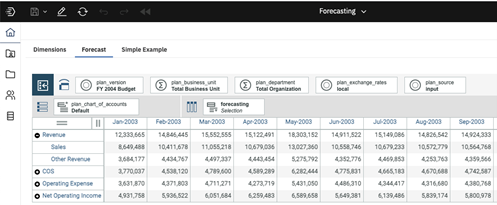
  1. Open the PAW book that contains your forecast view. Previewing the forecast in IBM Planning Analytics
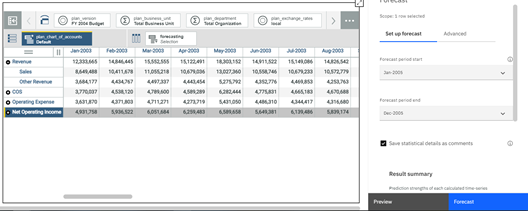
  2. Click anywhere on the view to activate it. Then click the Forecast icon in the ribbon at the top of the screen. This will open the Forecast window on the right-hand side of your screen. Configure the forecast settings if you have not already done so. Previewing the forecast in IBM Planning Analytics
  3. Click on one of the elements in your row dimension to select the row. Then click the Preview button in the Forecast window on the right-hand side of your screen. Previewing the forecast in IBM Planning Analytics
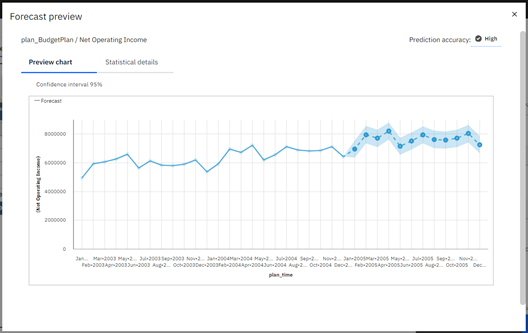
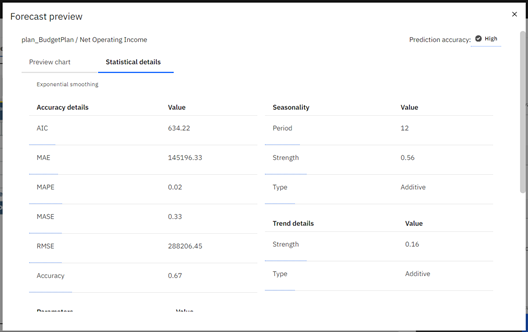
  4. The Forecast preview window will open. There are two tabs with information about the forecast:

a. Preview chart

Previewing the forecast in IBM Planning Analytics

The Preview chart depicts displays the forecasted data, along with a surrounding shaded area. There is a 95% chance that the actual values will fall in this shaded area (or cloud).

b. Statistical details

Previewing the forecast in IBM Planning Analytics

The Statistical details tab provides key information used by the model to forecast your data. Read more about these values here.

In our next blog post, we will review how to run your Planning Analytics Forecasting model.

IBM Planning Analytics, which TM1 is the engine for, is full of new features and functionality. Not sure where to start? Our team here at Revelwood can help. Contact us for more information at info@revelwood.com. And stay tuned for more Planning Analytics Tips & Tricks weekly in our Knowledge Center and in upcoming newsletters!

Read more IBM Planning Analytics Tips & Tricks:

IBM Planning Analytics Tips & Tricks: Configuring the Time Dimension

IBM Planning Analytics Tips & Tricks: Configuring the Forecast Settings

IBM Planning Analytics Tips & Tricks: Convert Existing View Directly to Reports

Home » enterprise performance management » Page 6

Filed Under: IBM Planning Analytics Tips & Tricks Tagged With: Budgeting Planning & Forecasting, enterprise performance management, Financial Performance Management, IBM Cognos TM1, IBM Planning Analytics, IBM Planning Analytics Forecasting, Planning & Forecasting, Planning Analytics tips, Planning Analytics Tips & Tricks, TM1

FP&A Done Right: Achieve More Reliable Financial Forecasting

February 26, 2021 by Revelwood Leave a Comment

This is a guest blog post from our partner Workday Adaptive Planning, written by Gary Cokins. Cokins is an internationally recognized expert, speaker and author in enterprise and corporate performance management systems. In this piece Cokins outlines three steps for more reliable forecasting.  

When a company fails to meet its financial targets, business leaders want to know why. Was it the pandemic? Did sales underperform? Did operations overspend? Were their purchases more expensive than expected? Was productivity below established standards? Did finance develop a forecast that was wrong from the start?

Determining the causes of budget variances is an effective way to avoid similar missteps in the future, as well as during times of disruption. But many businesses struggle to understand the causes of variances and to define a process that will turn out accurate forecasts every quarter.

Finance and business teams must work together to identify the activities or data gaps that led to a missed forecast projection and caused price, cost, and efficiency variances. Whether poor decisions were made, the business landscape changed, or customer needs evolved, digging into the root cause starts with building relationships based on trust and transparency.

Companies need to continuously answer these three questions: What? So what? and Then what? Answering the first question—What happened?—requires good reporting with visibility. Answering the second question—So what?—involves separating the signal from the noise and determining what is relevant from the reporting. Arguably, answering the third question—Then what?—is the most important and critical part, because only these decisions impact the future.

Here are three tips that will help your finance team set performance targets and standards that company leaders can be confident in.

Step #1: Bring everyone to the table

Hitting a financial forecast isn’t just about meeting sales goals. Employee turnover, travel expenses, marketing costs, and other operational expenditures must be accurately projected to create a viable financial forecast.

But finance teams can’t analyze all these variables on their own. They need to work closely with sales, HR, marketing, operations, and executive teams to get a clear view of past performance, changes on the horizon, and potential risks and opportunities.

Centralizing financial information in a single shared database reduces the time it takes for finance teams to gather this information, giving them more time to focus on analyzing causes of variances and speculating on potential outcomes. Collaborative financial planning software also helps keep information up-to-date by making reporting easier for other departments.

It may take time to get the whole company on board with a new data collection, integration, and delivery process, but the payoff that comes with more reliable reporting is worth the effort.

Step #2: Plan for multiple outcomes

It’s impossible to know for certain what the future might hold. No one has a crystal ball for this. But there are ways to view the planning horizon. One way is to create multiple projections that account for different scenarios. This can include sensitivity analysis by changing some of the variables, such as the forecast sales volume and mix, to calculate projected profits. This can keep your company running on all cylinders—regardless of what comes its way.

Project for at least two possible outcomes—one optimistic and another cautious—so you can create proactive response plans. Look closely at the assumed factors and variables that are most likely to impact your projections. For instance, a change in the price of raw materials, in labor rates, or the emergence of a new competitor could create pricing pressure, which might lead to a decline in revenues.

Scenario planning can also help companies navigate regulatory changes that come with political transition or turmoil. According to a survey by KPMG, 77% of U.S. CEOs say they are focusing more on scenario planning to manage change in the current political environment.

However, with the increasing responsibilities falling on FP&A teams, many feel they don’t have enough time for this type of proactive planning. Sixty percent of CFOs estimate that ad hoc analysis, such as running a new scenario for the forecast, takes up to five days, according to a survey we published a few years back.

Planning and budgeting software can help FP&A teams speed up the time it takes to outline the financial implications of different scenarios and outcomes. The right tool lets teams run reports with the click of a few buttons, giving them more time to consider the risks, opportunities, and assumptions to create comprehensive response plans.

Step #3: Collect customer data

Understanding changing customer preferences, needs, and demands can also help improve the accuracy of financial projections—and boost a company’s overall financial health. However, a third of U.S. CEOs say the depth of their customer insights is limited by a lack of quality customer data, according to KPMG. So it’s no surprise that nearly two-thirds expect to invest in data analytics technology in the next three years.

“The whole idea of knowing what the customer wants before they want it is sort of the brass ring,” Tom Hayes, president and CEO of Tyson Foods, told KPMG. “We have real-time data from the shelf back to our supply chain. It takes out a lot of waste and helps us to more accurately forecast—a great benefit for products with a short shelf life.”

Taking the right steps to figure out where a missed forecast and associated assumptions went wrong will help keep business performance on target year after year.

This blog post was originally published on the Workday Adaptive Planning blog.

Read more FP&A Done Right posts:

FP&A Done Right: There is Life After December – The Fixed Forecast Dilemma

FP&A Done Right: Rolling Forecasts for More Strategic FP&A

FP&A Done Right: The Role of KPIs in Driver-Based Budgets

Home » enterprise performance management » Page 6

Filed Under: FP&A Done Right Tagged With: Adaptive Insights, Budgeting Planning & Forecasting, enterprise performance management, Financial Performance Management, forecasting, FP&A, FP&A done right, Workday Adaptive Planning

Workday Adaptive Planning Tips & Tricks: Interactive Dashboards – Dynamic Planning with Embedded Sheets

February 24, 2021 by Dave Miersch Leave a Comment

More often than not, clients of Revelwood will make use of multiple sheets in Workday Adaptive Planning to support different aspects of their planning process(es). When using several sheets to make changes to key drivers, assumptions and scenario drivers, clients often ask the question, “How can I quickly and easily see how the changes I make on one sheet impact the rest of my budget?” One tried and true method was using multiple screens or windows with multiple sheets or reports open to see how the model changes. While this method works, it can be cumbersome and as many of us are working remotely for the foreseeable future, it likely becomes problematic if we do not have access to all those great monitors at home.

Another more dynamic solution is using the newer functionality of embedded sheets within Dashboards.

Within Dashboards, users now have the ability to add any Standard, Modeled, or Cube sheet you have created within Adaptive Planning to enter data without ever having to navigate away from our dashboard view(s). These sheets act as usable copies of your existing sheets allowing changes to be made and instantly reflected on related charts and dashboards.

In the below example, we have three Dashboards. Sales Volume & Margin by Month, budgeted Sales Revenue vs Prior Year Actuals and budgeted Sales Volume vs Prior Year Actuals.

Interactive dashboards in Workday Adaptive Planning

While in edit mode, navigate to the dashboard selector and simply drag and drop the “Sheet” option into your dashboard window. An additional drop-down menu will then be available to select all available sheet options to choose from.

Learn about interactive dashboards in Workday Adaptive Planning

Select the appropriate sheet you want to use to make changes and analyze the overall model impact and you’re all set! You now have your previously created and defined sheet embedded within your dashboard.

In my example, we have added our “Bottle Release Schedule” sheet which is essentially our sales unit planning sheet.

Understanding interactive dashboards in Workday Adaptive Planning

Making any changes and saving them within the Dashboard will automatically funnel through to dependent charts and dashboards. We are going to add 1,000 units sold in the month of April 2021 in rows 1 and 3, click save in the sheet, and then see how those changes impact our entire model in real time.

Dynamic planning with embedded sheets in Workday Adaptive Planning

We can quickly see that making those changes has added 2,000 units to our total sales volume as well as $300,000 in additional revenue.

Any sheet created within Adaptive can be pulled into dashboards for more fluent and flexible planning and reporting in one view. While some functionality is limited vs using the sheet itself, having the ability to make changes and immediately see the impact without managing multiple windows can be a valuable tool in the heart of budget season.

The team at Revelwood has been recognized by Workday Adaptive Planning for our thought leadership in the space, commitment to our Workday Adaptive Planning practice, and our rapid achievements of milestones. Visit Revelwood’s Knowledge Center for our Workday Adaptive Planning Tips & Tricks or sign up here to get our Workday Adaptive Planning Tips & Tricks delivered directly to your inbox. Not sure where to start with Workday Adaptive Planning? Our team here at Revelwood can help! Contact us info@revelwood.com for more information.

Read more Workday Adaptive Planning Tips & Tricks:

Workday Adaptive Planning Tips & Tricks: Override Formulas in Sheets

Workday Adaptive Planning Tips & Tricks: Templates

Workday Adaptive Planning Tips & Tricks: The Formula Assistant – How To, Where & Why

Home » enterprise performance management » Page 6

Filed Under: Workday Adaptive Planning Tips & Tricks Tagged With: Adaptive Insights, adaptive insights tips & tricks, adaptive planning dashboards, adaptive planning embedded sheets, enterprise performance management, Financial Performance Management, Workday Adaptive Planning, Workday Adaptive Planning Tips & Tricks

IBM Planning Analytics Tips & Tricks: Planning Analytics Forecasting – Configuring the Forecast Settings

February 23, 2021 by Nina Inverso Leave a Comment

Tips & Tricks

This is part one of a three-part series on IBM Planning Analytics new Forecasting feature.

The new IBM Planning Analytics Forecasting feature allows you to quickly populate future time periods based on past data values. This feature is especially useful to prepopulate a data set for you or your team to then adjust as you see fit. Configuring the forecast settings only takes a few minutes, and the results can be powerful.

  1. Open the PAW book that contains your forecast view. Configuring forecast settings in IBM Planning Analytics
  2. Click anywhere on the view to activate it. Then click the Forecast icon in the ribbon at the top of the screen. This will open the Forecast window on the right-hand side of your screen. How to configure forecast settings in IBM Planning Analytics
  3. There are two tabs used to configure the forecast:
    • Set up forecast
      • Use the drop-down lists to select the forecast period start and end elements.
      • Click the checkbox next to “Save statistical details as comments” if you want to disable this feature. By default, information pertaining to the forecast is saved as a comment within the view.
    • Advanced
      • Click the switch next to “Auto-detect” to disable seasonality. This feature is enabled by default.
      • Optionally, use the drop-down list to select one or more time periods for the model to ignore.
      • Use the drop-down list to select a confidence interval. This is set to 95% by default.
      • iv. Edit the table to configure the version dimension, hierarchy, and elements that should be used to store the model’s predictions.
Configure forecast settings in Planning AnalyticsConfiguring forecast settings in Planning Analytics

In our next blog post, we will review how to preview your Planning Analytics Forecasting model.

IBM Planning Analytics, which TM1 is the engine for, is full of new features and functionality. Not sure where to start? Our team here at Revelwood can help. Contact us for more information at info@revelwood.com. And stay tuned for more Planning Analytics Tips & Tricks weekly in our Knowledge Center and in upcoming newsletters!

Read more IBM Planning Analytics Tips & Tricks:

IBM Planning Analytics Tips & Tricks: Planning Analytics Forecasting – Configuring the Time Dimension

IBM Planning Analytics Tips & Tricks: Converting Existing View Directly to Reports

IBM Planning Analytics Tips & Tricks: Maintaining Subset Driven Consolidations

Home » enterprise performance management » Page 6

Filed Under: IBM Planning Analytics Tips & Tricks Tagged With: Budgeting Planning & Forecasting, enterprise performance management, Financial Performance Management, IBM Cognos TM1, IBM Planning Analytics, IBM Planning Analytics forecast, TM1

Workday Adaptive Planning Tips & Tricks: Excel Reporting Using a Report Template

February 17, 2021 by Summer Jeter Leave a Comment

Many users of Workday Adaptive Planning utilize OfficeConnect for their Excel reporting. But not all users will have access to OfficeConnect, depending on your organization. But there is another great option for Excel reporting called a Report Template.

What is the difference between OfficeConnect and a Report Template?

Templates are Excel files which can be added to regular reports, including repeating reports. Instead of running an HTML report, you can have a custom Excel report. Below are some nice features, as once you use it, it will become a favorite for reporting.

Report Templates allow:

  • Custom formatting data from Adaptive such as background color, font color, and font type.
  • Calculations on the data, along with including graphs and notes.
  • Use with repeating reports.
  • A saved Excel file attached to a report.
  • Macros can be added to templates.

Here is a quick tutorial on how to create an Excel report using a report template.

  1. Locate the Adaptive Planning HTML report which has the data you want for your Excel report.

    a. Here is an HTML Report.

    Workday Adaptive Planning: Excel Reporting

    b. Locate the report in the Reports screen.

    Workday Adaptive Planning: Using a template for Excel reporting
  2. Right click on the report and choose Run as Excel, and the file will download. Learn about Excel reporting using a template in Workday Adaptive Planning
  3. Open the downloaded Excel file. You will see the Excel data on the first sheet.

    a. The report is the same as the report in Step 1 but in Excel.

    How to do Excel reporting with a template in Workday Adaptive Planning
  4. On this sheet, you can change fonts, and add conditional formatting, calculations, etc. If you want to add other sheets for more reporting, you can use formulas to reference data on the first sheet.

    a. In this example, we have changed fonts style and added conditional formatting for the % Var column.

    How to do Excel reporting with a template in Workday Adaptive Planning

    b. In this example, we added another sheet and created a graph and ratios using formulas to reference the first sheet (report data). You can add multiple sheets to create a customized report or a report book. You can also hide sheets. For example, the Report Info tab Adaptive includes in all excel reports or the first sheet with the data.

    Excel reports using templates in Workday Adaptive Planning
  5. Return to the report in Adaptive Planning.

    a. Right click on the same HTML report and select Attach Template.

    Excel reporting using templates in Workday Adaptive Planning

    b. Click Choose File button and select the excel file you just created which has your updated report with formatting, formulas, graphs, etc. Click OK. Once the file is selected click Open.

    Excel reporting using templates in Workday Adaptive PlanningExcel reporting using templates in Workday Adaptive Planning

    c. The file icon will change colors from blue to green, so you know the report has been properly attached.

    Excel reporting using templates in Workday Adaptive Planning
  6. Run the report and it will automatically download as an Excel file. Your existing report has been generated and has applied all applicable prompts. For example, the month of data will change per the prompt option selected.

You now have an Excel report! And can run it anytime!

The team at Revelwood has been recognized by Adaptive for its thought leadership in the space, commitment to its Adaptive Insights practice, and its rapid achievements of milestones. Visit Revelwood’s Knowledge Center for our Adaptive Insights Tips & Tricks or sign up here to get our Adaptive Insights Tips & Tricks delivered directly to your inbox. Not sure where to start with Adaptive Insights? Our team here at Revelwood can help! Contact us info@revelwood.com for more information.

Read more Workday Adaptive Planning Tips & Tricks:

Workday Adaptive Planning Tips & Tricks: Expand/Collapse in OfficeConnect

Workday Adaptive Planning Tips & Tricks: Templates

Workday Adaptive Planning Tips & Tricks: Making Your Matrix Report Presentable and Meaningful

Home » enterprise performance management » Page 6

Filed Under: Workday Adaptive Planning Tips & Tricks Tagged With: Adaptive Insights, adaptive insights tips & tricks, adaptive planning report template, enterprise performance management, Financial Performance Management, FP&A, OfficeConnect, Workday Adaptive Planning, Workday Adaptive Planning OfficeConnect, Workday Adaptive Planning Tips & Tricks

IBM Planning Analytics Tips & Tricks: Planning Analytics Forecasting – Configuring the Time Dimension

February 16, 2021 by Nina Inverso Leave a Comment

Tips & Tricks

The new IBM Planning Analytics Forecasting feature allows you to quickly populate future time periods based on past data values. This feature is especially useful to prepopulate a data set for you or your team to then adjust as you see fit. Because it is time-based, the feature requires that a time dimension has been set up in a specific way.

  1. Ensure that the cube where you want to forecast includes a time dimension.
  2. Make sure the dimension type is set to TIME.

    a. Sign into PAW and open a new book. In the navigation pane, right-click on the Dimensions section, and click Edit settings. 

    Configuring Time Dimension in IBM Planning Analytics Forecasting Model

    b. Click on the Dimensions Attributes Mode button in the upper right-hand corner of the window.

    Learn how to configure the time dimension in IBM Planning Analytics Forecasting Model

    c. Enter TIME as the DIMENSION_TYPE if blank.

    How to configure the time dimension in IBM Planning Analytics Forecasting Model
  3. Make sure you have a flat hierarchy available.

    a. In the navigation pane, right-click on the dimension name, and click Create hierarchy.

    Understand how to configure the time dimension in IBM Planning Analytics Forecasting Model

    b. Enter a new hierarchy name and click the CREATE button.

    Learn to configure the time dimension in IBM Planning Analytics Forecasting Model

    c. Use the dimension editor to add base-level time elements to the new hierarchy. The easiest way to accomplish this is by copying element names from an existing hierarchy in the dimension.

    Your time dimension is now ready to use in a Planning Analytics Forecasting model.

IBM Planning Analytics, which TM1 is the engine for, is full of new features and functionality. Not sure where to start? Our team here at Revelwood can help. Contact us for more information at info@revelwood.com. And stay tuned for more Planning Analytics Tips & Tricks weekly in our Knowledge Center and in upcoming newsletters!

Read more IBM Planning Analytics Tips & Tricks:

IBM Planning Analytics Tips & Tricks: Converting Existing View Directly to Reports

IBM Planning Analytics Tips & Tricks: PAx Task Pane Workbook Tab

IBM Planning Analytics Tips & Tricks: Maintaining Subset Driven Consolidations

Home » enterprise performance management » Page 6

Filed Under: IBM Planning Analytics Tips & Tricks Tagged With: Budgeting Planning & Forecasting, enterprise performance management, Financial Performance Management, forecasting, IBM Cognos TM1, IBM Planning Analytics, Planning & Forecasting, Planning Analytics Forecasting model, Planning Analytics Tips & Tricks, TM1

FP&A Done Right: The Role of KPIs in Driver-Based Budgets

February 12, 2021 by Revelwood Leave a Comment

This is a guest blog post from our partner Workday Adaptive Planning, on why finance teams should focus on KPIs and business drivers.

Gone are the days when business leaders were narrowly focused on just the net cash flow or balance sheet. Modern finance pros are asked to track not only a lengthy list of metrics, but also KPIs beyond the traditional finance arena. The old adage is, “You get what you measure.” When managers are held accountable for attaining or exceeding KPI targets defined by the executive team, their actions and decisions become aligned to the executives’ strategy.

Why the focus on KPIs and business drivers? Well, more leaders are realizing that to stay competitive and agile, their formulated strategies need to be managed and executed and that traditional budgets are no longer cutting it. Creating detailed, upfront financial projections for the next year and allocating budgets and planning inventory to cost centers no longer makes sense in today’s rapidly changing business environment. Instead, staying nimble and strategically savvy means embracing active planning and driver-based budgets. These driver-based budgets are categorized by:

  • Budgeting and planning in smaller batches with horizon-adjusted precision
  • Allocating resources in a fast and flexible manner
  • Tying budgets and planning inventory to outcomes rather than cost centers

Identify the KPIs that drive your financial results

Most organizations have a company-wide set of standardized and consistent metrics they track. But what are the KPIs that truly impact the company’s financial performance?

The answer will vary from industry to industry and company to company, but identifying the right drivers means considering the entire operational arc of the business. For instance, you might have drivers from:

  • Pipeline or funnel: prospective customer leads, first meetings, opportunities, sales generated pipeline, add-on revenue, channel sourced pipeline
  • Sales: total customers, ramped representatives, average revenue per deal, current quarter pipeline, new logos, future quarter pipeline
  • Customer success: customer satisfaction score, at-risk customer retention, cancellations, billable hours, time to value, average hold time
  • Finance: manufacturing costs, freight and distribution, free net cash flow, revenue per headcount, cost per headcount
  • Marketing: website visits, event attendees, new vs. returning leads, social followers, database size, earned media

Shift the conversation

“Did you hit your numbers?” That’s a question anyone who’s worked in a static planning environment has probably encountered. But with a driver-based budget and active planning, the psychology around targets actually shifts. Instead of thinking in operational silos and individual or department wins, the conversation becomes more integrated thinking about end-to-end business processes across the silos. Rather than hitting a static target, people are working to make sure certain drivers are meeting or exceeding expectations, to help fuel future success and growth at the organization.

Sometimes, that subtle but powerful shift can be hard for executives to wrap their heads around. But once the C-suite is sold on driver-based budgeting, the results usually speak for themselves. And many execs find that the forward-looking approach of driver-based budgets and KPIs actually aligns better with how they operate: with an eye toward the future, rather than toward the past.

Stop forecasting to the end of year

With an annual plan or budget, fiscal year end Dec. 31 is the end line. But business doesn’t actually come screeching to a halt at the end of the fiscal calendar year, and all of the effort required to put together an annual budget can be so onerous and complicated that it might take months in advance to assemble. That means some teams are racing toward an artificial deadline with little to no visibility into what the budget will bring even a few months into the future. Sounds like a nightmare, right?

We’re not arguing to do away with the annual plan. But with a driver-based approach, it’s easier to also create a rolling financial forecast—a roadmap for the next quarter or six months or 12 months, no matter what point you’re at in the fiscal calendar. Creating a rolling financial forecast isn’t nearly as time-intensive or intimidating as you might think when you have the input variables and parameter supported by an automated system. Because this forecasting happens more frequently and because it’s based on drivers and KPIs—rather than every single granular data point at the finance team’s fingertips—a rolling financial forecast can be both quick and sophisticated.

Are you ready to dramatically increase the agility, alignment, and accuracy of your company’s budget? It starts with shaking free of the status quo—static planning, traditional budgets, myriad metrics—and focusing on the business drivers and KPIs that will actually shape the future financial performance.

This blog post was originally published on the Workday Adaptive Planning blog and appeared here.

Check out more FP&A Done Right posts here:

FP&A Done Right: Predictions of “Extraordinary” Growth This Year

FP&A Done Right: Collaborate More When Planning

FP&A Done Right: Achieve More Reliable Financial Forecasting

Home » enterprise performance management » Page 6

Filed Under: FP&A Done Right Tagged With: Adaptive Insights, Budgeting, Budgeting Planning & Forecasting, driver-based budgeting, driver-based budgets, enterprise performance management, Financial Performance Management, key performance indicators, KPIs, Workday Adaptive Planning

IBM Planning Analytics Tips & Tricks: Dimension Attribute Types

February 9, 2021 by Marc Assenza Leave a Comment

Tips & Tricks

Did you know that IBM Planning Analytics dimensions can have defined types and that these defined types are necessary for certain Planning Analytics features to operate correctly? For example, the new predictive forecasting functionality within Planning Analytics Workspace (PAW) requires the use of a designated Time dimension.

To view your dimension definitions in Planning Analytics Workspace, right-click on Dimensions and click “Edit settings” from the context menu.

IBM Planning Analytics Tips: Dimension Attribute Types

The dimensions view will open in Dimensions Security Mode. To see the dimension types, switch to Dimensions Attributes Mode.

IBM Planning Analytics Tricks: Dimension Attribute Types

Attributes for each dimension are then presented. Not every dimension needs to have a defined dimension type, but some dimensions need to be defined to use specific functionality. The following types can be defined:

  • GEOGRAPHY – Used in Planning Analytics Workspace to allow the visualization of your data using geographic maps.
  • TIME – Contains specified and recognized intervals of time utilized within a budgeting, planning, forecasting, and reporting structure.
  • CALCULATION – Contains formulas used to perform intended operations against your data.
  • METRIC – Contains a group or groups of elements that will be used to measure a business’s Key Performance Indicators (KPI’s).
  • METRIC INDICATORS – Provides further information in relation to Key Performance Indicators (KPI’s), an example of this is trend.
  • VERSIONS – Contains data from multiple uses of an element, such as current budget for a department for this year compared against the department’s budgets for prior years.
  • GENERIC – Used when there is no precise type of dimension type required. These general members can include things like products and customers. Please note this can be changed at any point if you determine the dimension should have had or needs to be a defined type.
  • HIERARCHY – This type of dimension is representative of the business reporting structure and can be used in tandem with workflow within an application.

This approach can be used with functionality associated with visualizations, predictive modeling, and other uses of Planning Analytics.

IBM Planning Analytics, which TM1 is the engine for, is full of new features and functionality. Not sure where to start? Our team here at Revelwood can help. Contact us for more information at info@revelwood.com. And stay tuned for more Planning Analytics Tips & Tricks weekly in our Knowledge Center and in upcoming newsletters!

Read more IBM Planning Analytics Tips & Tricks:

IBM Planning Analytics Tips & Tricks: PA Modeling – The Dimension Editor

IBM Planning Analytics Tips & Tricks: Simplifying Dimension Maintenance

IBM Planning Analytics Tips & Tricks: Subset Control Dimension

Home » enterprise performance management » Page 6

Filed Under: IBM Planning Analytics Tips & Tricks Tagged With: Budgeting Planning & Forecasting, enterprise performance management, Financial Performance Management, IBM Cognos TM1, IBM Planning Analytics, Planning & Forecasting, Planning & Reporting, Planning Analytics tips, Planning Analytics Tips & Tricks, TM1

  • « Go to Previous Page
  • Page 1
  • Interim pages omitted …
  • Page 4
  • Page 5
  • Page 6
  • Page 7
  • Page 8
  • Go to Next Page »

Footer

Revelwood Overview

Revelwood helps finance organizations close, consolidate, plan, monitor and analyze business performance. As experts in solutions for the Office of Finance, we partner with best-in-breed software companies by applying best practices guidance and our pre-configured applications to help businesses achieve their full potential.

EXPERTISE

  • Workday Adaptive Planning
  • IBM Planning Analytics
  • BlackLine

ABOUT

  • Who We Are
  • What We Do
  • How We Help
  • How We Think
  • Privacy

CONNECT

World Headquarters

Florham Park, NJ | 201 984 3030

European Headquarters

London & Edinburgh | +44 (0)131 240 3866

Latin America Office

Miami, FL | 201 987 4198

Email
info@revelwood.com

Copyright © 2025 · Revelwood Inc. All rights reserved. Revelwood® and the Revelwood logo are registered marks of Revelwood Inc.