Part of implementing IBM Planning Analytics is ensuring that users understand their model. This often entails documentation that is created as a Microsoft Word document. Most of us know how to use Word but get frustrated typing some of the complex OLAP terms that are required to explain the model. Did you know that Word has a feature which allows you to solve this?
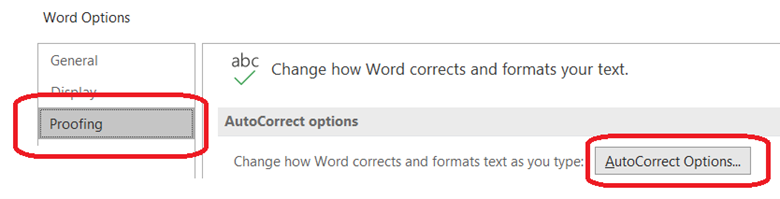
The AutoCorrect feature in Word allows you to define an abbreviation which is replace when you complete a word. This is defined by going into the Word options and selecting Proofing, AutoCorrect Options.
In addition to the list of predefined abbreviations that Microsoft has set up, I use this for the following list of words:
Abbreviation Full Phrase
consol consolidation
consols consolidations
dim dimension
dims dimensions
hier hierarchy
hiers hierarchies
scen scenario
I also use this to quickly set up arrows and bullets:
— → (an arrow)
* • (a bullet point)
This approach will help you create documents, both notes and formal manuals, faster and easier vs. having to stop and correct the complicated words that arise in our OLAP world.
IBM Planning Analytics, which TM1 is the engine for, is full of new features and functionality. Not sure where to start? Our team here at Revelwood can help. Contact us for more information at info@revelwood.com. And stay tuned for more Planning Analytics Tips & Tricks weekly in our Knowledge Center and in upcoming newsletters!
Learn more IBM Planning Analytics Tips & Tricks:
IBM Planning Analytics Tips & Tricks: Learn the Excel CELL Formula
IBM Planning Analytics Tips & Tricks: Manipulating Text in Excel
IBM Planning Analytics Tips & Tricks: Excel Keyboard Navigation