Watch our latest IBM Planning Analytics Tips & Tricks video to learn how to simplify dimension maintenance in Planning Analytics. Once you master these easy techniques, you’ll be able to do all of your dimension maintenance from the Planning Analytics Workspace (PAW) administration screen.
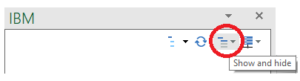
In this video, Lee Lazarow, Revelwood’s FP&A technology director, demonstrates how to maintain your dimensions in PAW. Lee shows you how to move elements using both a standard drag-and-drop approach and a wizard-based approach. You’ll also see how to create new hierarchies and how to manipulate your dimension structure without going to a different screen.
By merging all aspects of a dimension together, you can do all your dimension maintenance from the PAW administration screen.
IBM Planning Analytics, which TM1 is the engine for, is full of new features and functionality. Not sure where to start? Our team here at Revelwood can help. Contact us for more information at info@revelwood.com. And stay tuned for more Planning Analytics Tips & Tricks weekly in our Knowledge Center and in upcoming newsletters!
Want to get our Planning Analytics Tips & Tricks delivered to your inbox every Tuesday? Sign up to get our weekly email of just the week’s tip!
Check out our IBM Planning Analytics Tips & Tricks video series:
Regions with Rules in IBM Planning Analytics
Bookmarking in IBM Planning Analytics