Loan amortization schedules in Workday Adaptive Planning are slightly different than those done in Excel.
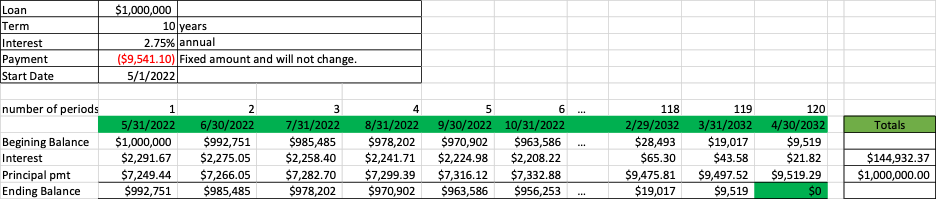
In Excel the typical amortization schedule looks like this:
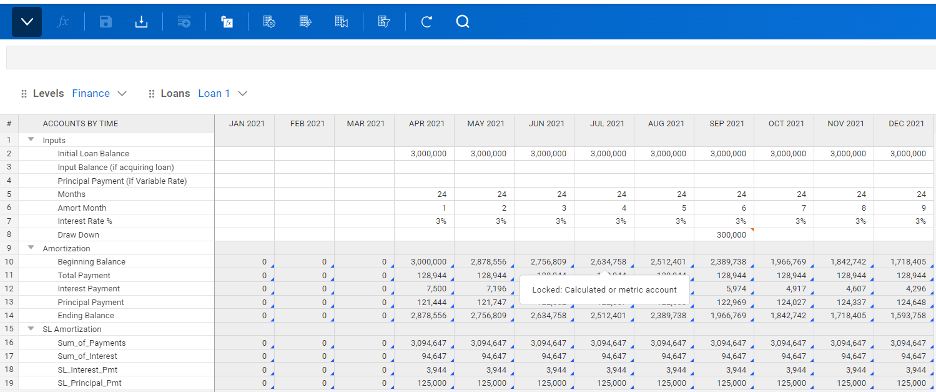
In Workday Adaptive Planning most versions only go 1-5 years into the future. Creating a complete 10-25 year amortization schedule is not the best practice. Here is an example of an Amortization Schedule in Adaptive:
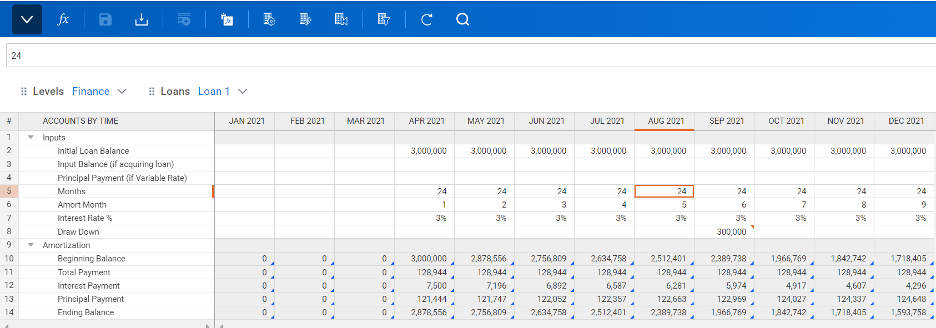
In Adaptive we show inputs in rows 2-8. Rows 10 through 14 are the formulas that calculate the interest per period, the principle and the declining principal balance.
Row 2: Input the initial loan balance for every month the loan will be active. If you are keying it in, as opposed to uploading a file from Excel, you can use Copy Forward rather than key it in every month.
Row 3: Input Balance (if acquiring the loan). Instead of the initial balance, put the balance as of assumption date.
Row 4: Principal Payment. This is used for variable rate loans
Row 5: The months will be the same just like the Initial Balance for every month that the loan is active.
Row 6: Amort Month is a counter that increases by 1 each month until the loan matures, then the field should go blank. In most cases the version will max out before the loan matures.
Row 7: Interest Rate %. This will be the same every month for fixed rate loans. For variable rate, forecast the expected rate by month.
Row 8: Draw Down. This is for additional payments.
The formula rows will calculate as follows:
Row 10: Beginning balance is equal to prior month ending balance.
Row 11: Total Payment. This is the most complicated formula and takes many scenarios into account using nested ifs. The basis of the formula is the payment formula; ie, Balance x i / ( (1+i) * (1- 1/( 1+I )^n ))
Row 12: Interest Payment. This takes the Beginning Balance * the Interest rate (monthly rate: rate/12)
Row 13: Principal Payment. This takes Total Payment – Interest Payment
Row 14: Ending Balance. This takes the Beginning Balance – Principal Payment – Draw Down
Follow up to Amortization is Conversion to Straight Line
Previously, we showed how to do a loan amortization in Adaptive Planning. Now we will go to the next step: Straight-line the interest according to GAAP in certain situations. Below is a loan amortization that takes the loan payments to maturity. The interest payments are summed. That sum is then divided evenly among the payments and the amortization schedule is redone with constant interest every month as shown in the second schedule.
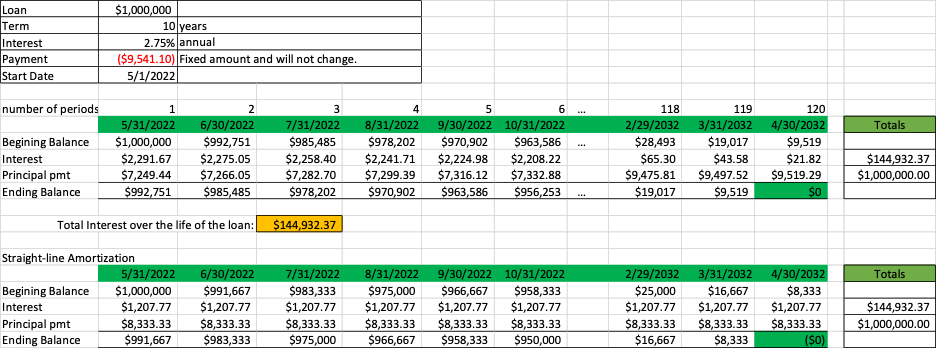
This is tricky in Adaptive Planning because a typical Excel schedule is run out to term since there are almost always sufficient columns in an Excel sheet to handle all the monthly payments. However, in Adaptive Planning, a typical version will be only 3 to 5 years into the future so only loans within 60 months of maturity could follow the same pattern.
For any longer maturities we have to apply the following logic. For loans with a constant monthly payment (which is most loans), calculate the payment. Then multiply the payment by the number of payments such as $9541.10 * 120 months, which is equal to $1,144,932.00 (slightly different by $0.37 due to rounding). Subtract the initial balance $1,144,932 – $1,000,000 = $144,932 which is the total of the interest. Now the Interest Payment will be equal to the total interest divided by the number of payments as seen below.
Now the GL account for Interest Expense can be linked to SL_Interest_Pmt and the GAAP reporting of Straight Line interest will be in the P&L.
Visit Revelwood’s Knowledge Center for our Workday Adaptive Planning Tips & Tricks or sign up here to get our Workday Adaptive Planning Tips & Tricks delivered directly to your inbox. Not sure where to start with Workday Adaptive Planning? Our team here at Revelwood can help! Contact us info@revelwood.com for more information.
Read more Workday Adaptive Planning Tips & Tricks:
Workday Adaptive Planning Tips & Tricks: Save Personal Views on Sheets with Dashboard