MDX enables you to query dimensions and cubes, lists of elements, data points, calculations, and more.
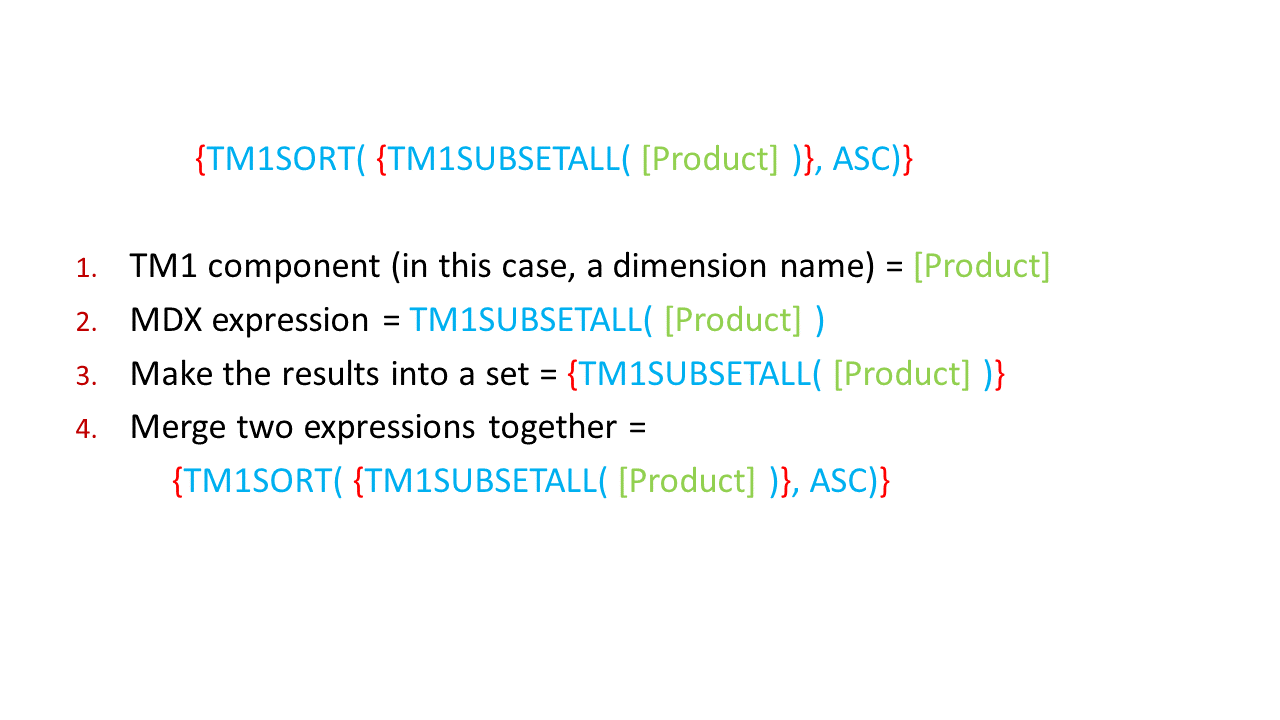
The first step in learning MDX is to understand the syntax. Below is an example of an MDX expression that returns all elements of the product dimension sorted in ascending order. To understand the expression, we’ve color-coded the syntax below.
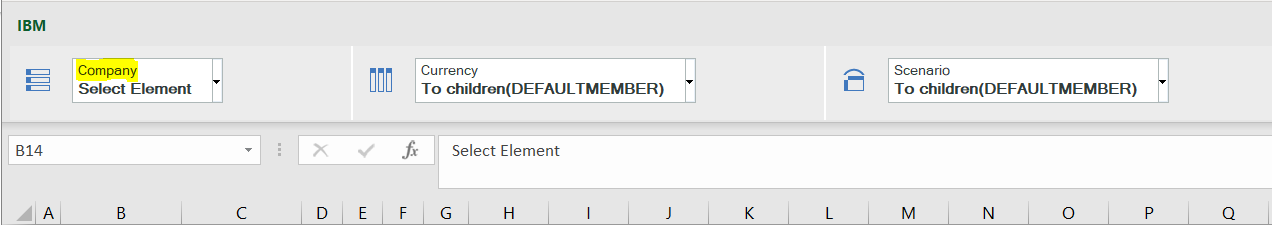
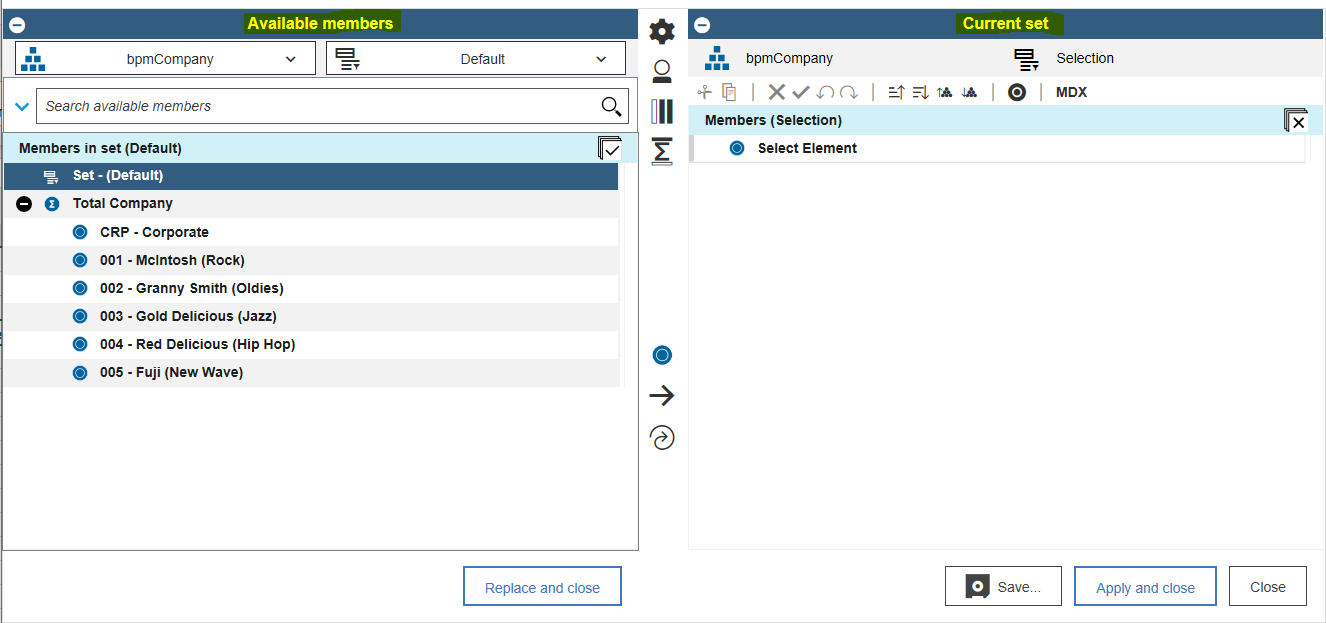
Part1, the part that is associated with the TM1 structure and model, is in green. This defines cubes, dimensions, hierarchies, elements and more.
Part 2, in blue, is the MDX Function.
Part 3 is in red. These are known as curly brackets or braces. These convert the results of the MDX Expression into a set.
The Expression below lets you list all elements of the product dimension and sort the list in ascending order:
Revelwood recently hosted a webinar on How to Use MDX in your IBM Planning Analytics Environment. Watch the recording to learn more about using MDX.
Interested in learning more about MDX? We have another MDX-specific webinar on Wednesday, November 9, 2022 at 1pm ET. Attendees will learn advanced MDX functions and see real-life examples of how Revelwood used MDX to address complex reporting requirements and to solve client challenges.
Have a question about MDX? Register for our upcoming webinar or reach out to us at info@revelwood.com
Revelwood has worked with IBM Planning Analytics / TM1 for more than 27 years. We’ve partnered with hundreds of companies on the design, development, maintenance and updates of IBM Planning Analytics applications, across every industry. Have a challenge with Planning Analytics / TM1? We can help you!
Read more IBM Planning Analytics Tips & Tricks on MDX:
IBM Planning Analytics Tips & Tricks: An Approach to Strengthening your MDX Skills
IBM Planning Analytics Tips & Tricks: Making Default Cube Views Dynamic with MDX
IBM Planning Analytics Tips & Tricks: Dynamic Subsets Based on a Cube